SHOW ME SOME LOVE AND SUPPORT
Website: TrackTheTropics.com/DONATE
Venmo: @TrackTheTropicsLouisiana
Cash App: Cash.App/$TrackTheTropics
Subscribe: FB.com/TrackTheTropics
Website: TrackTheTropics.com/DONATE
Venmo: @TrackTheTropicsLouisiana
Cash App: Cash.App/$TrackTheTropics
Subscribe: FB.com/TrackTheTropics
2 Day Tropical Weather Outlook

5 Day Tropical Weather Outlook
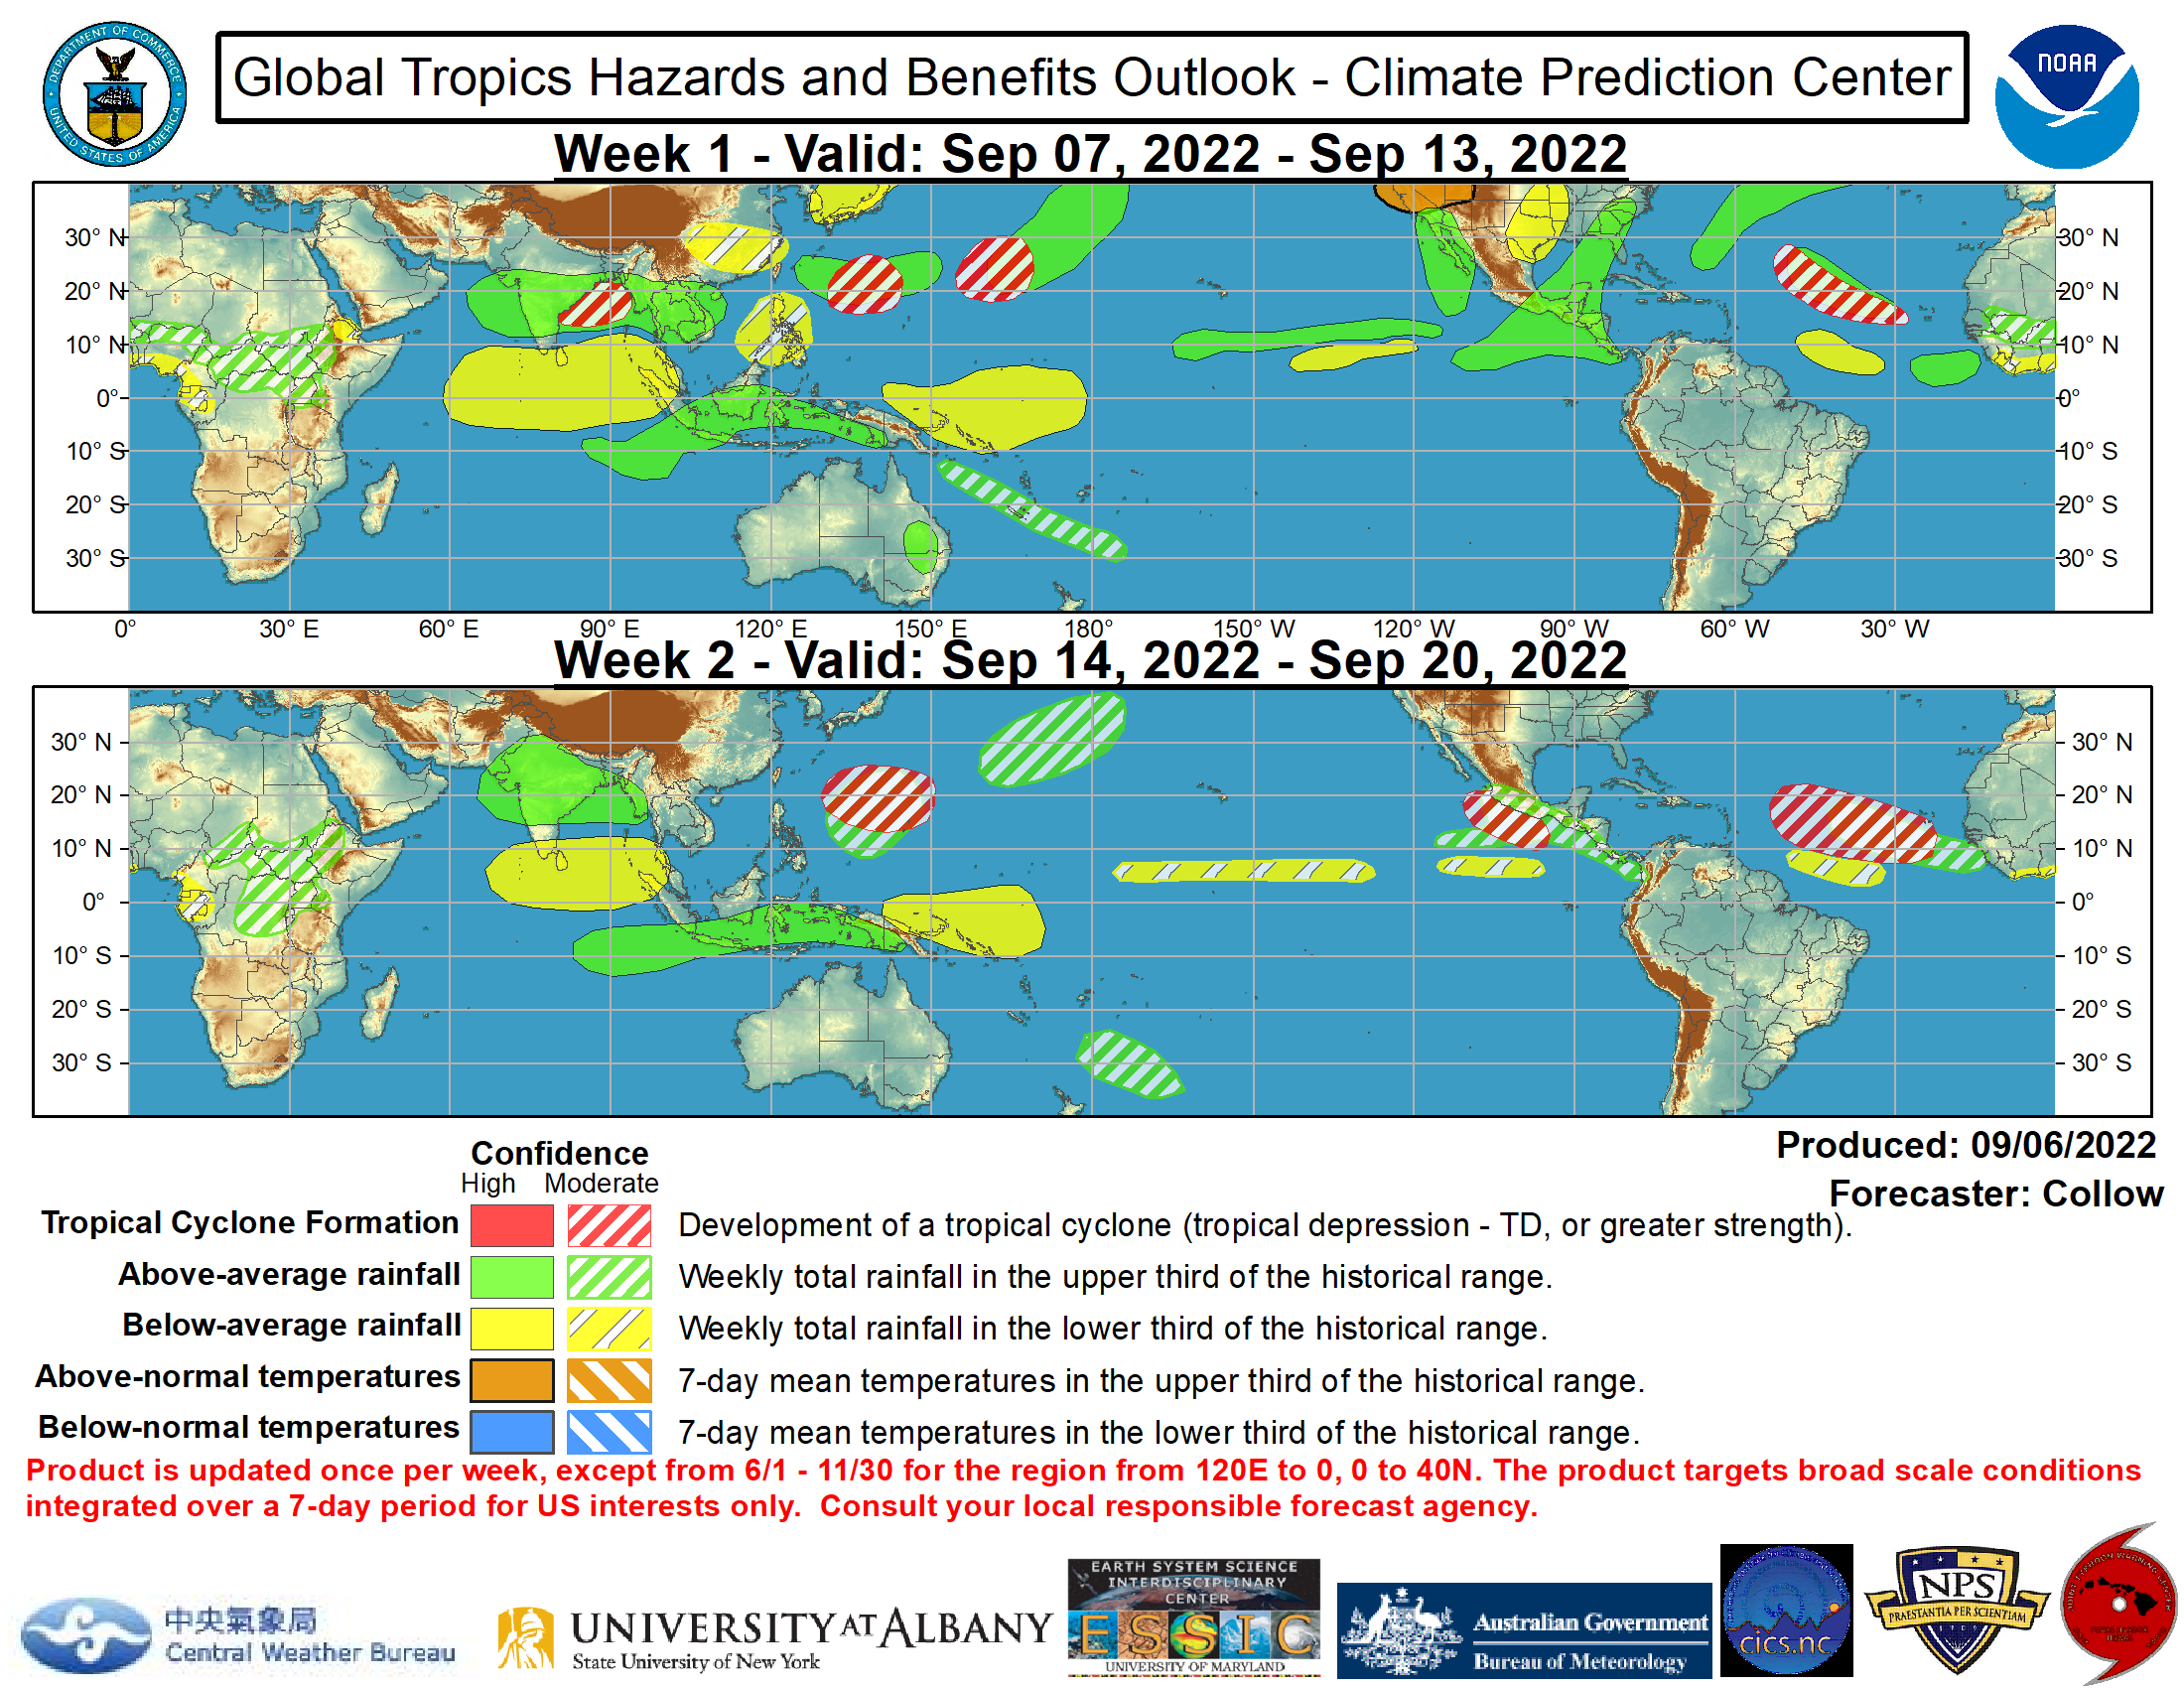
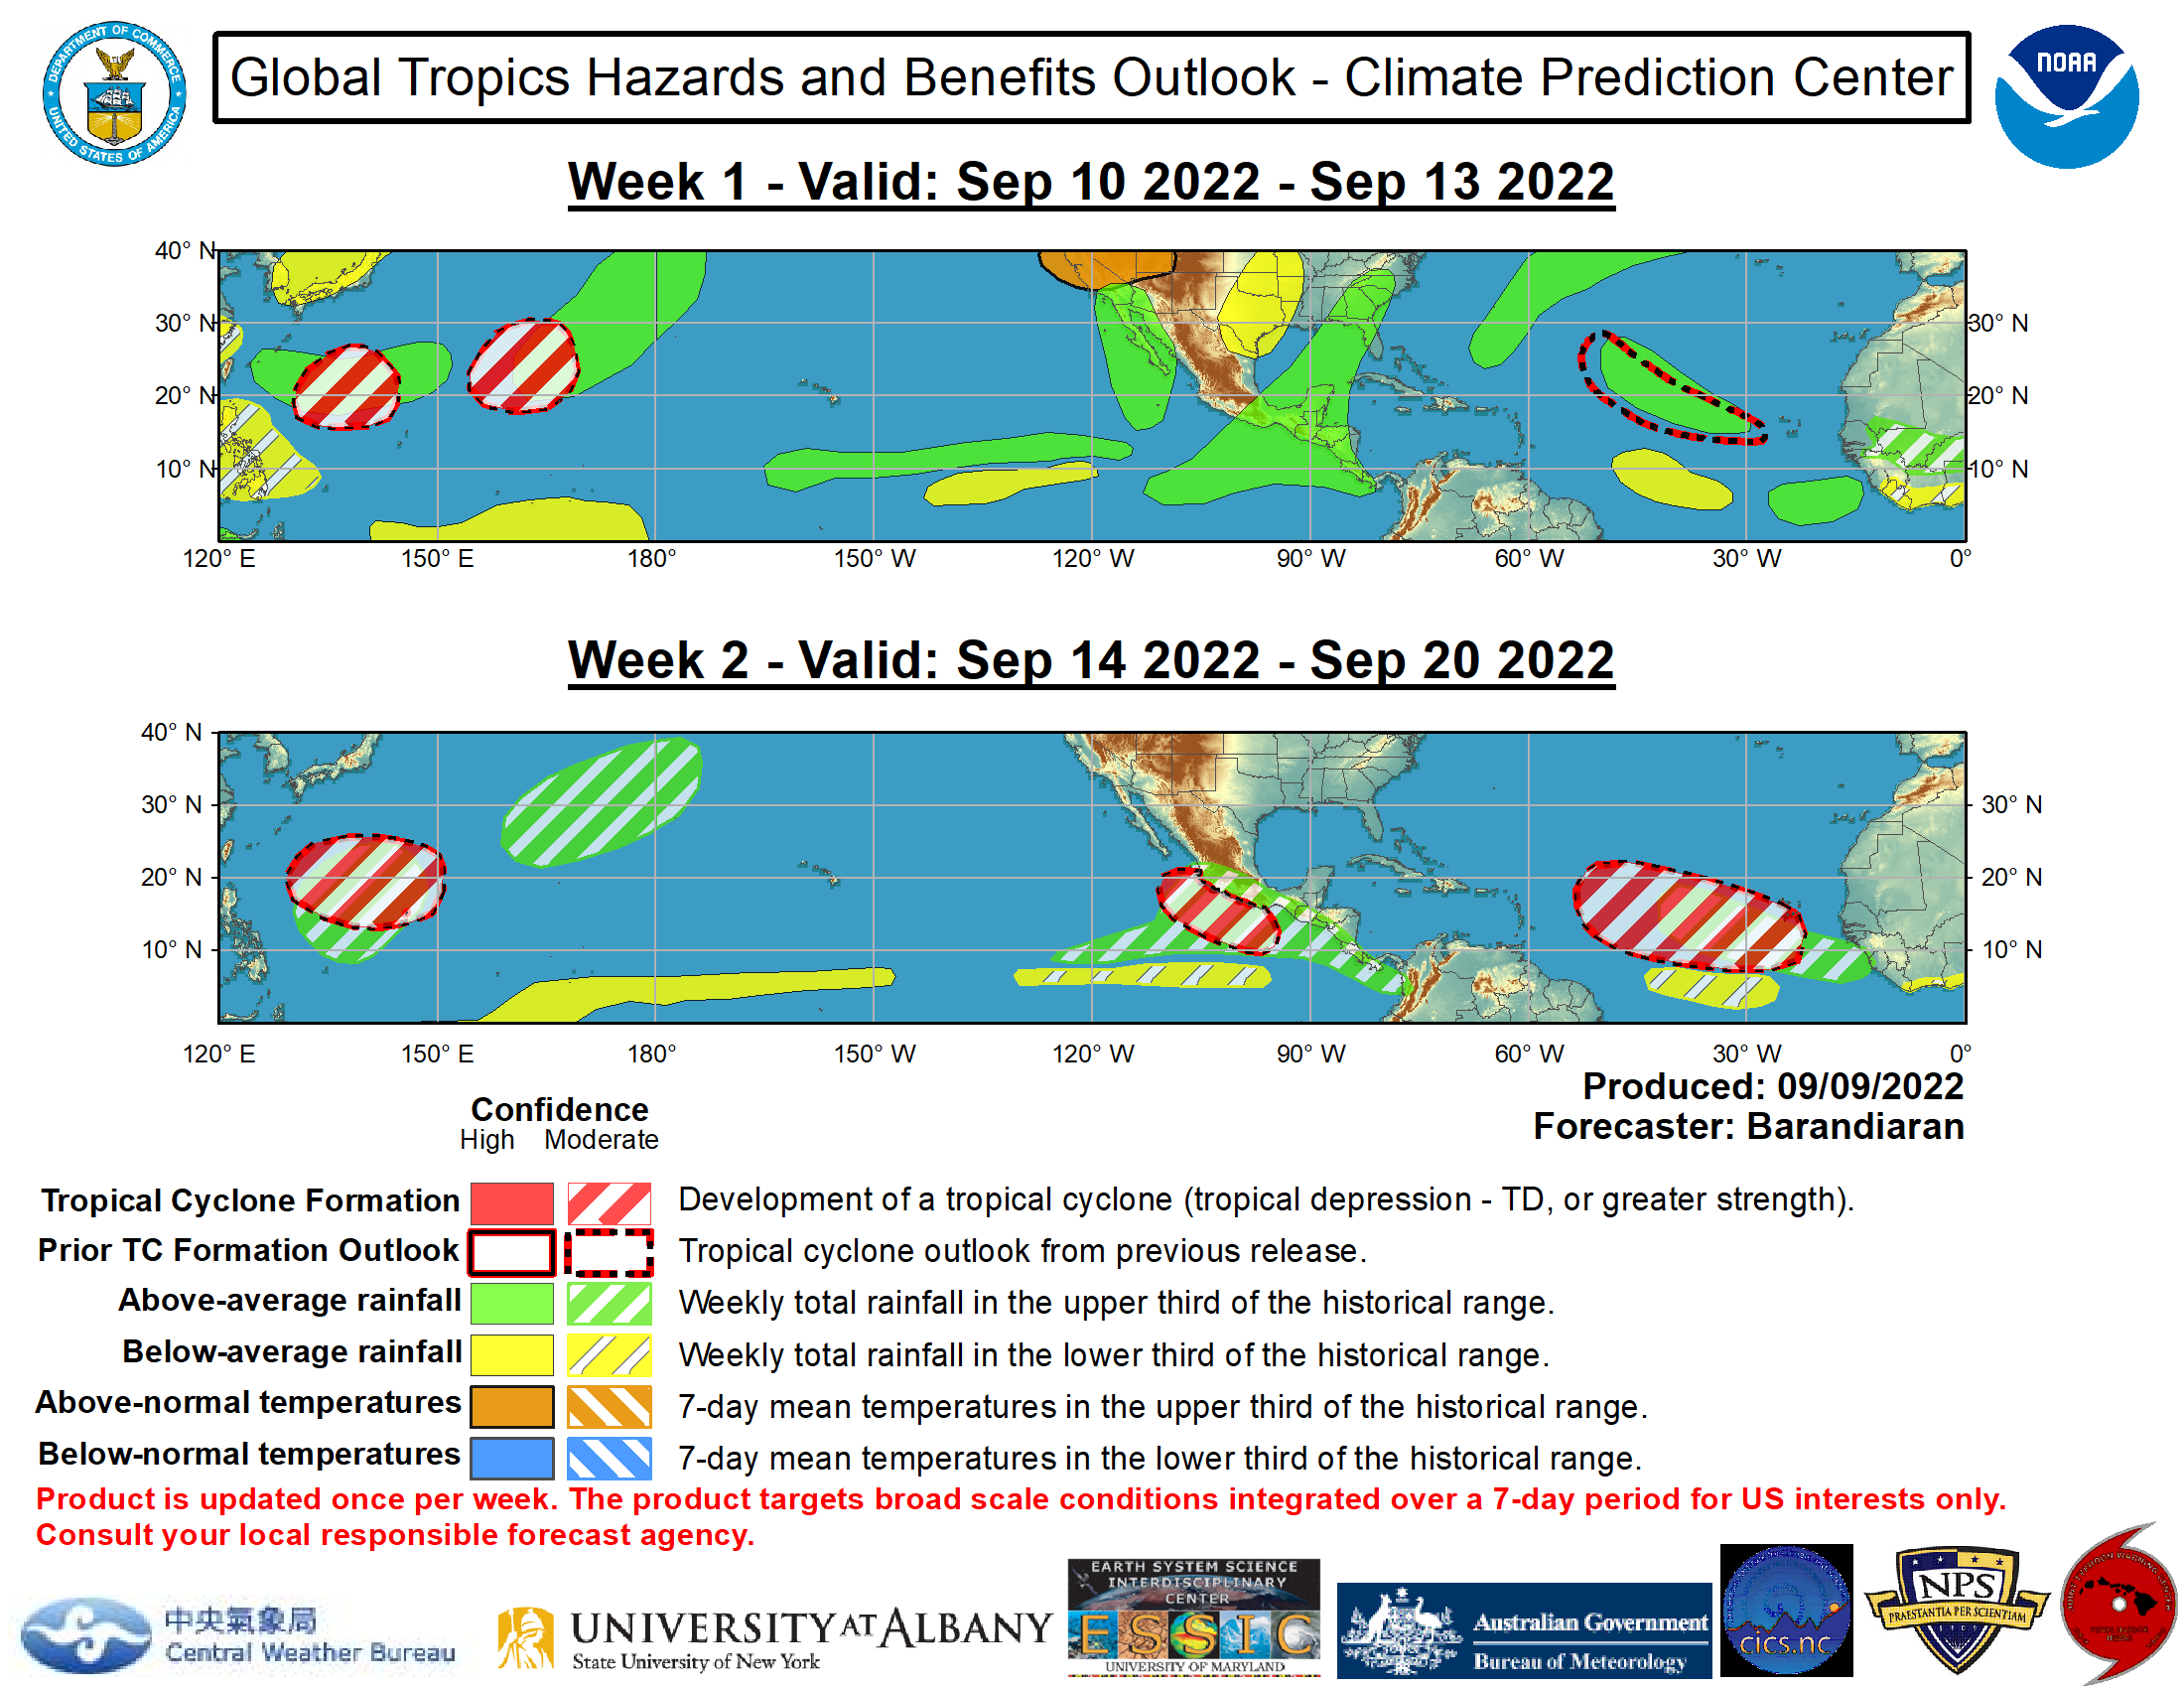
Global Tropics Outlook
East Coast Radar

NOAA 0-24 hour TC Formation Probability

NOAA 0-48 hour TC Formation Probability
NOAA 0-48 hour TC Formation Probability VIEW ALL TC PROBABILITY RUNS
NOAA 0-48 hour TC Formation Probability
NOAA 0-48 hour TC Formation Probability VIEW ALL TC PROBABILITY RUNS
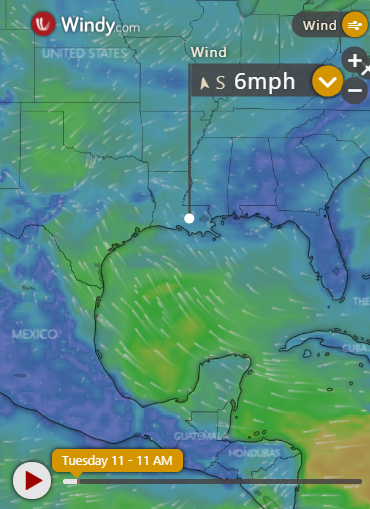
Live Current and Future Winds

Tropical Intensity Index

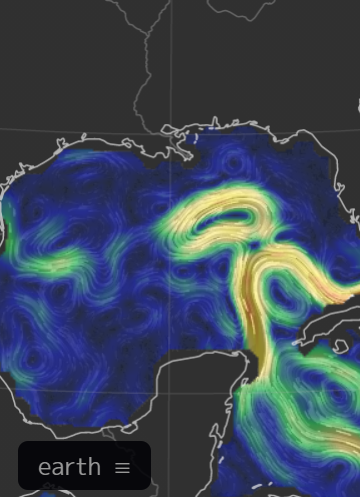
Live Ocean Currents
Current Tropical Surface Analysis Maps
Tropical Atlantic
 Southwest Atlantic
 Gulf of Mexico
 Southeast US Coast
 Caribbean
Southwest Atlantic
Gulf of Mexico
Southeast US Coast
Caribbean
00Z Runs of TC Genesis Probability
Ensemble-based Probability (%) of TC Genesis Consensus (NCEP, CMC and ECMWF)
0-48 Hours 0-120 Hours
 120-240 Hours

0-48 Hours
0-120 Hours
120-240 Hours
Ensemble-based Probability (%) of TC Genesis Consensus (NCEP)
0-48 Hours
 0-120 Hours
 120-240 Hours

0-120 Hours
120-240 Hours
East Coast/ West Atlantic Satellite Loops
GEOColor IR
 Infrared

Visible
 Water Vapor

 Infrared

Visible
 Water Vapor

Current Sea Surface Temperatures


Gulf Of Mexico

Gulf Of Mexico
Sea Surface Temperature Anomaly


Shear Tendency Past 24 Hours
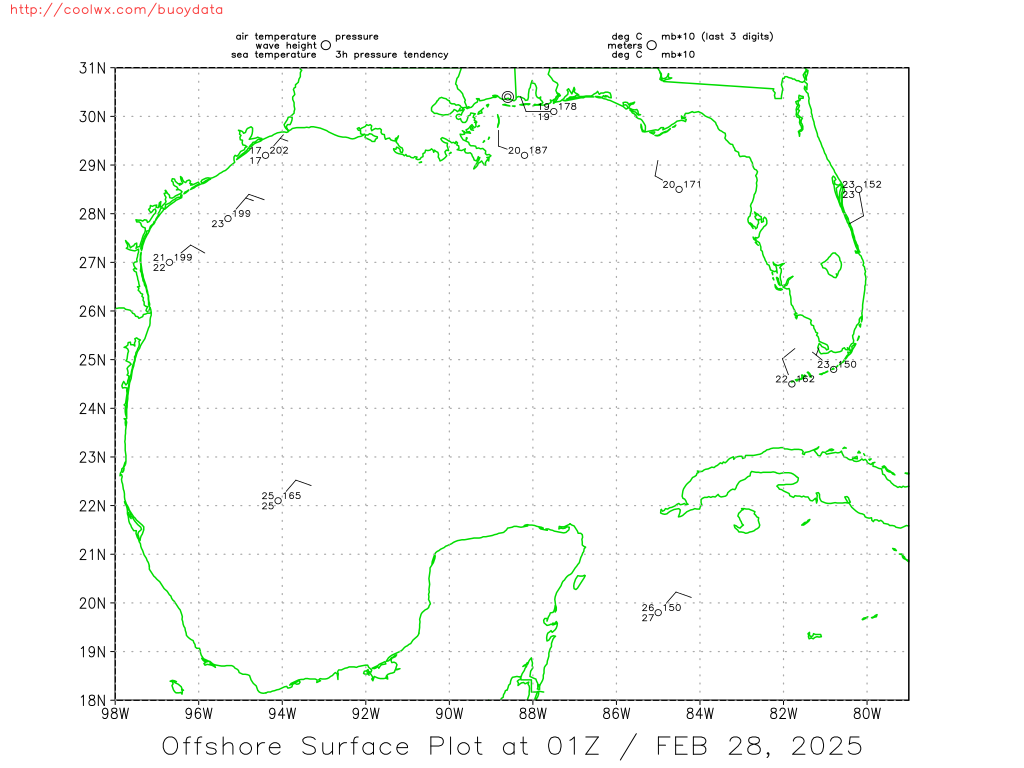
Gulf Buoy Data
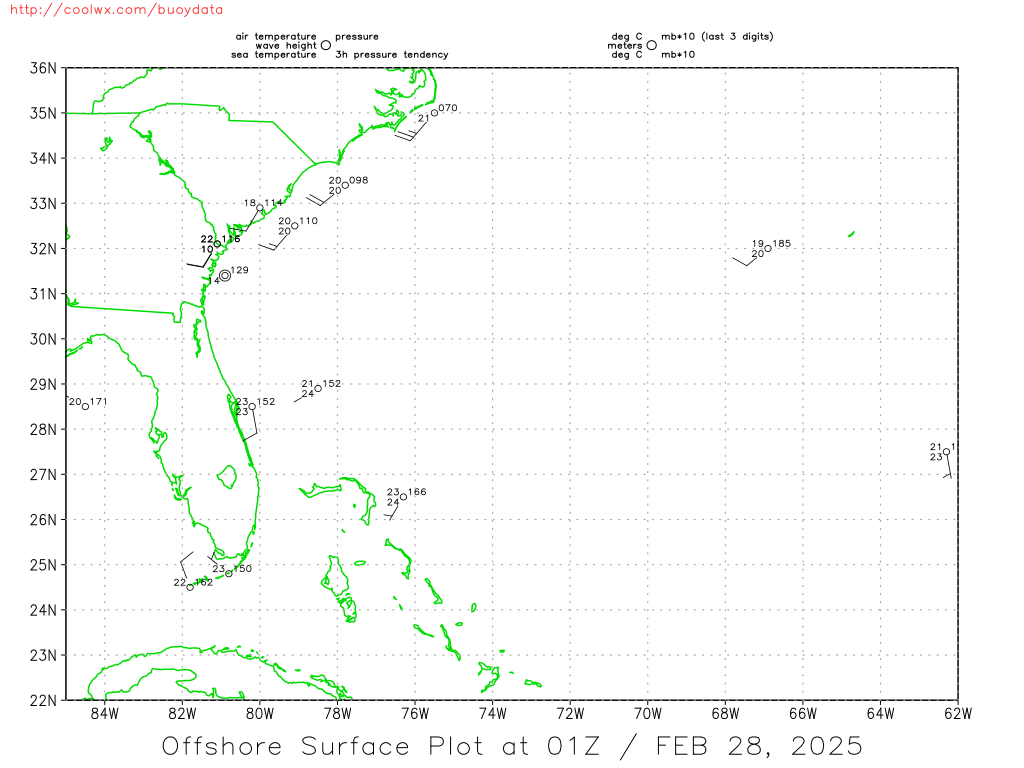
 Southeast Coast Buoy Data
 Caribbean Buoy Data
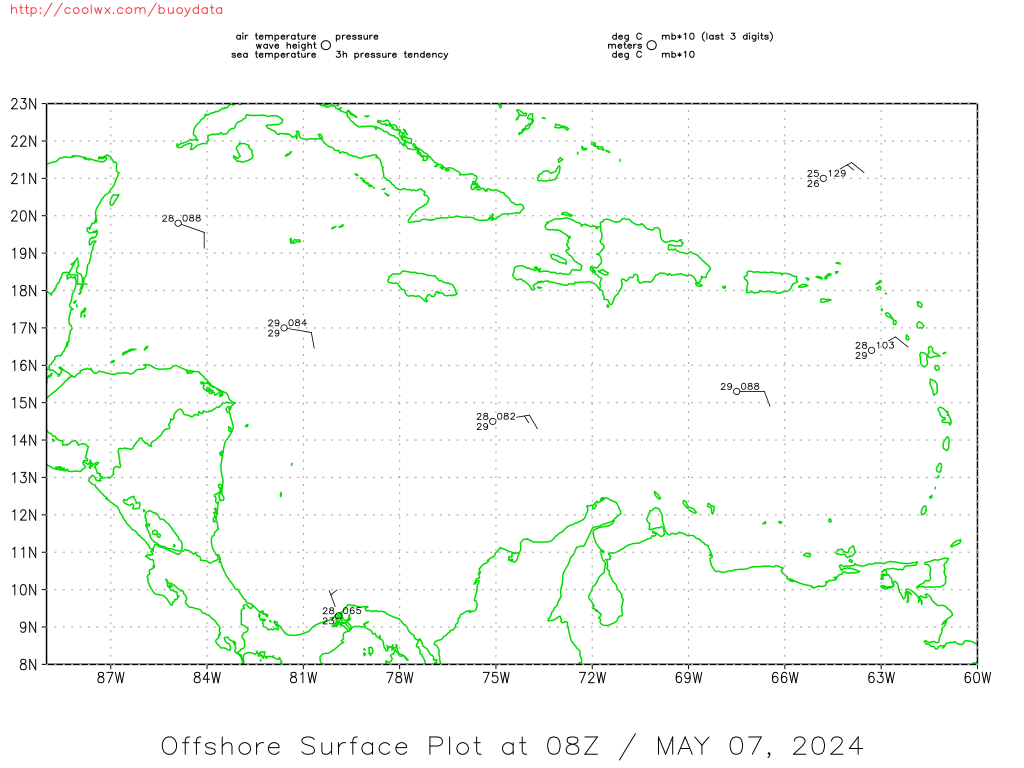
Southeast Coast Buoy Data
Caribbean Buoy Data
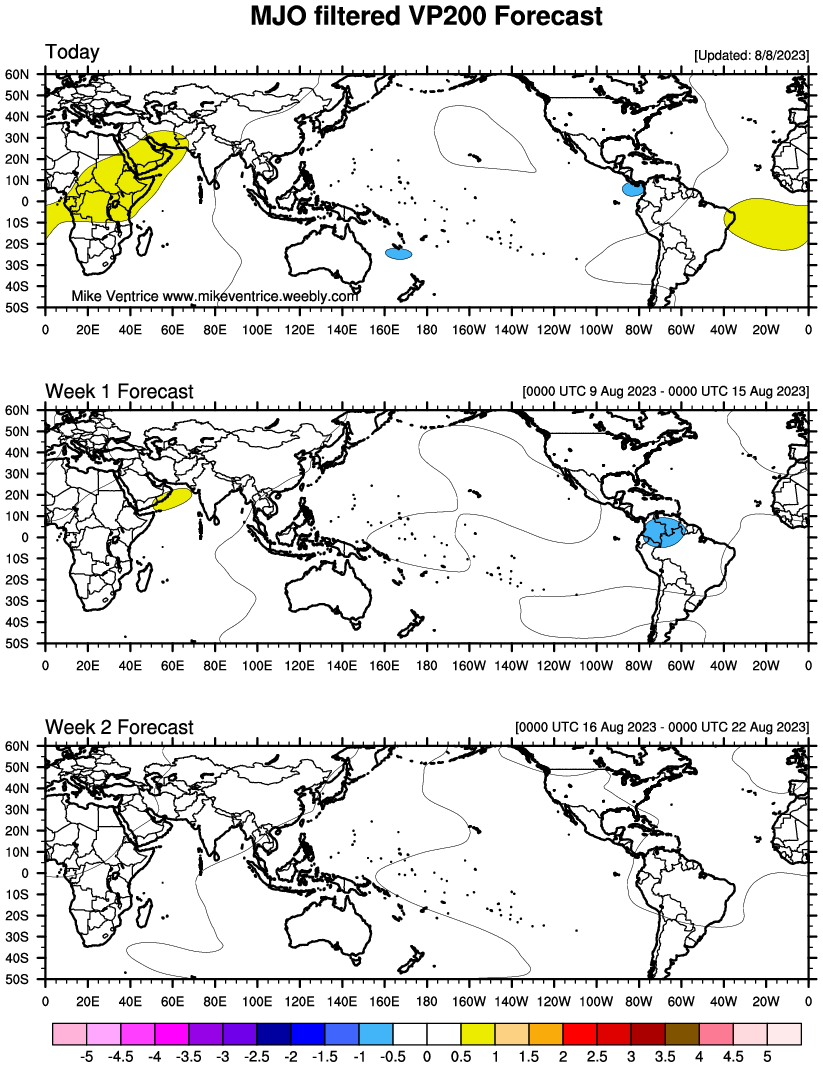
MJO Extended Forecast
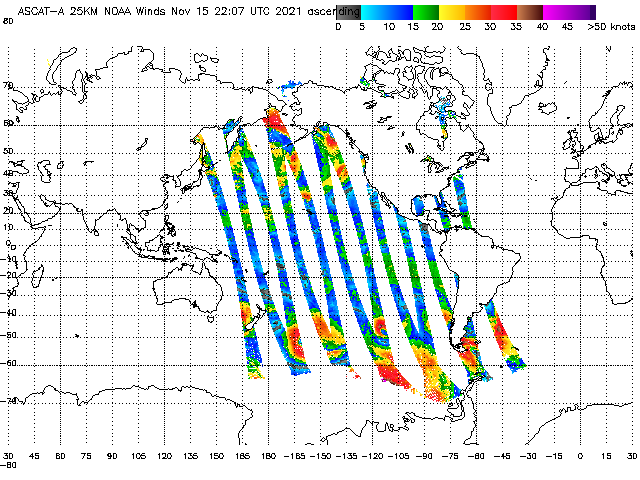
ASCAT Data (Ascending/Descending)

Future Shear Forecasts
24 hour

48 hour
72 hour
48 hour
72 hour
Hurricane Strike Percentages
![[Map of return period in years for hurricanes passing within 50 nautical miles]](http://www.nhc.noaa.gov/climo/images/return_hurr_sm.jpg)
Estimated return period in years for hurricanes passing within 50 nautical miles of various locations on the U.S. Coast
![[Map of return period in years for major hurricanes passing within 50 nautical miles]](http://www.nhc.noaa.gov/climo/images/return_mjrhurr_sm.jpg) Estimated return period in years for MAJOR passing within 50 nautical miles of various locations on the U.S. Coast
Estimated return period in years for MAJOR passing within 50 nautical miles of various locations on the U.S. Coast
![[Map of return period in years for hurricanes passing within 50 nautical miles]](http://www.nhc.noaa.gov/climo/images/return_hurr.jpg)
Estimated return period in years for hurricanes passing within 50 nautical miles of various locations on the U.S. Coast
![[Map of return period in years for major hurricanes passing within 50 nautical miles]](http://www.nhc.noaa.gov/climo/images/return_mjrhurr.jpg) Estimated return period in years for MAJOR passing within 50 nautical miles of various locations on the U.S. Coast
Estimated return period in years for MAJOR passing within 50 nautical miles of various locations on the U.S. Coast
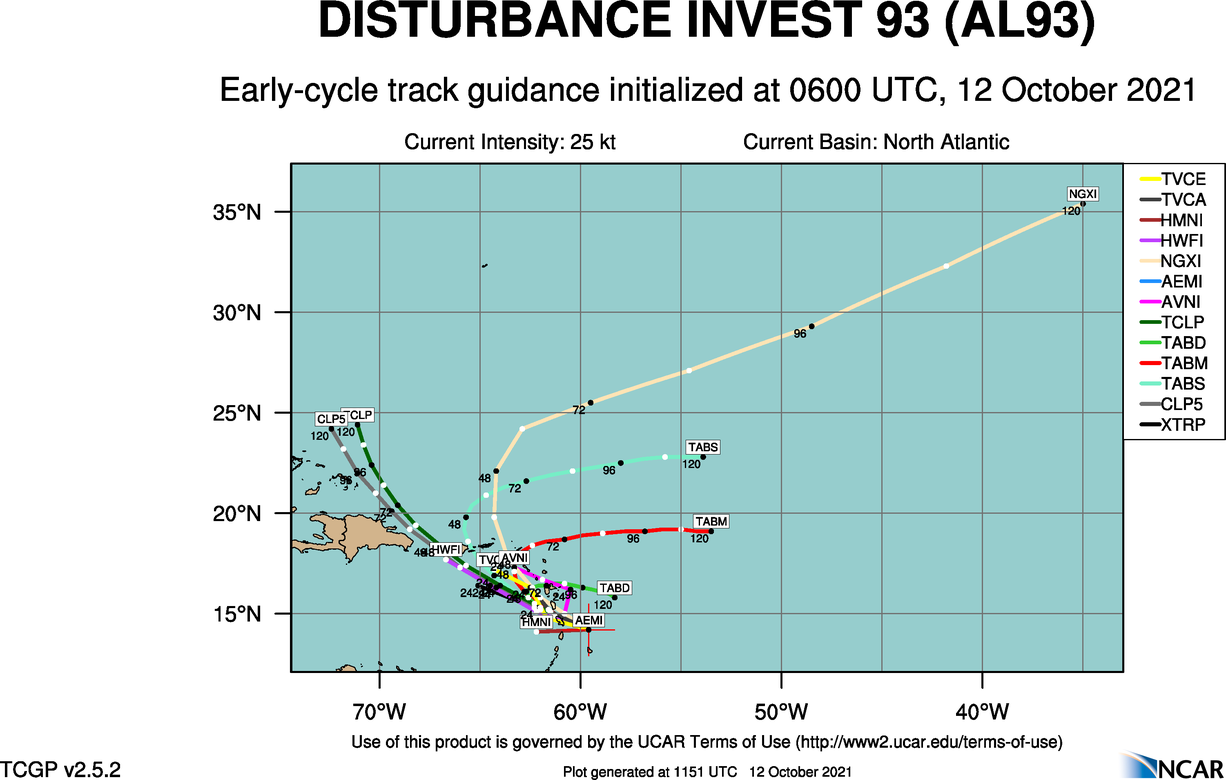
ALERT: Tracking Invest 93L
Western Gulf Coast Radar Loop
Central Gulf Coast Radar Loop
Eastern Gulf Coast Radar
Northeast Coast Radar

Precipitation Forecasts
Next 24 Hours QPF Total

Next 5 days QPF Totals

Next 7 Days QPF Totals

View all Precipitation forecasts
Next 5 days QPF Totals
Next 7 Days QPF Totals
View all Precipitation forecasts
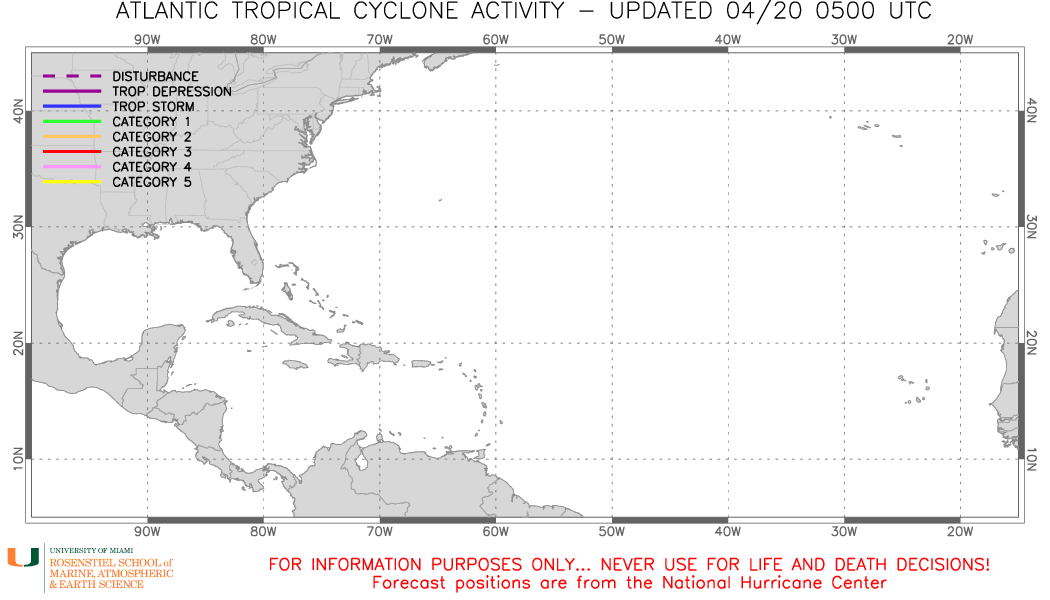
Atlantic Tropical Cyclone Activity
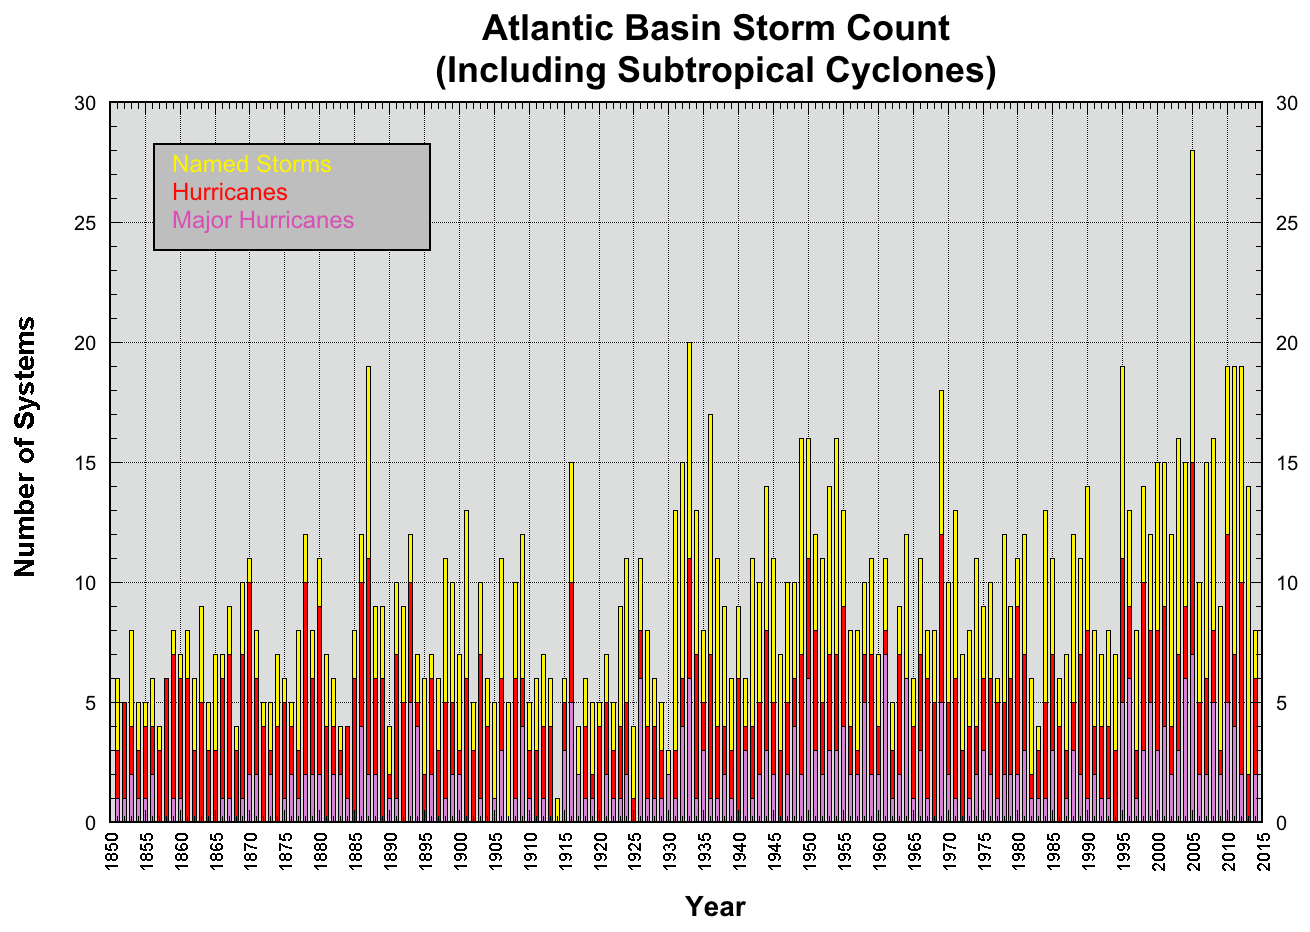
Atlantic Basin Storm Count Since 1850
US Forecast View
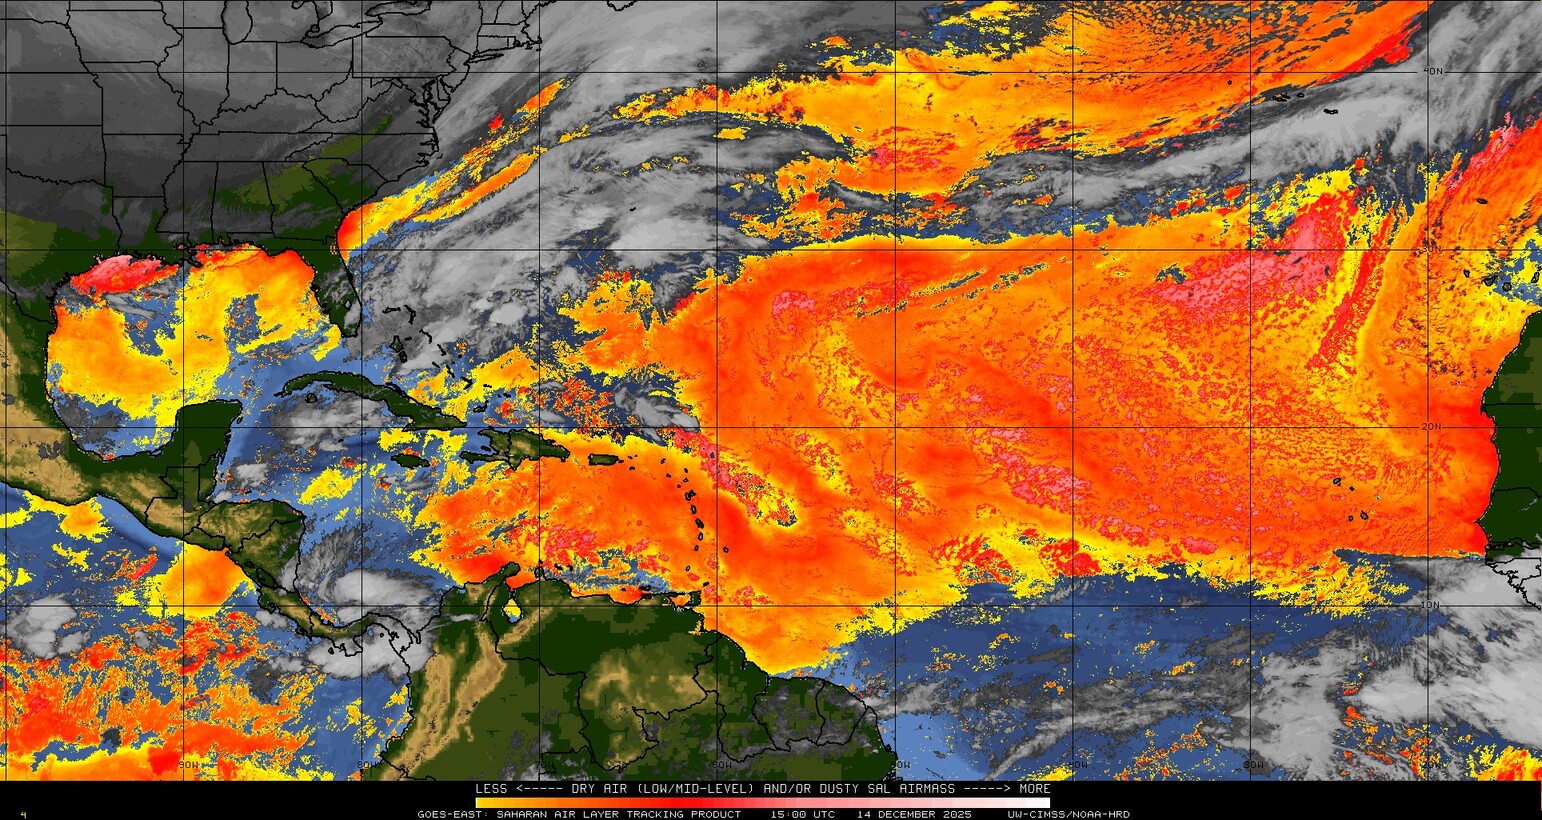
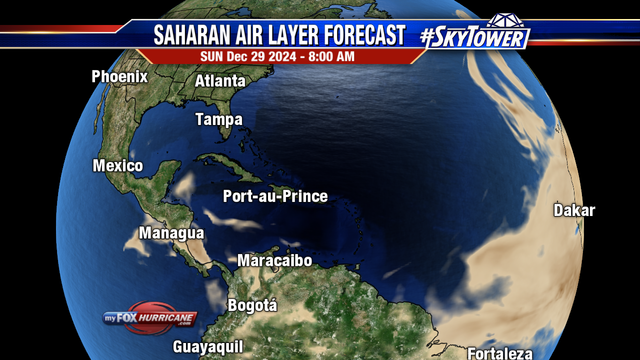
Saharan Air Layer (Dry Air)
Typical Tropical Cyclone Origins and Tracks by Month
June
July
August
September
October
November
July
August
September
October
November
Ensemble-based Probability (%) of TC Genesis Consensus (NCEP)
0-48 Hours
0-120 Hours
120-240 Hours
0-48 Hours
0-120 Hours
120-240 Hours
Gulf of Mexico Satellite Loops
GEOColor IR
 Shortwave IR
 Visible
 Water Vapor

GEOColor IR
 Shortwave IR
 Visible
 Water Vapor

Current Vorticity
850mb
700mb
850mb
700mb
Tropical Cyclone Heat Potential


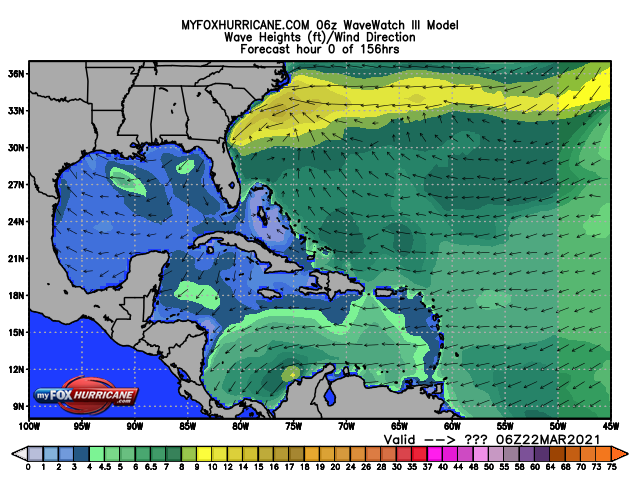
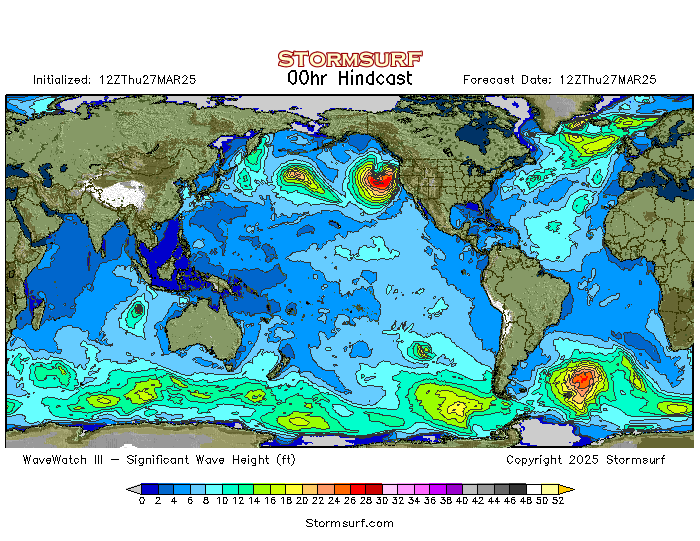
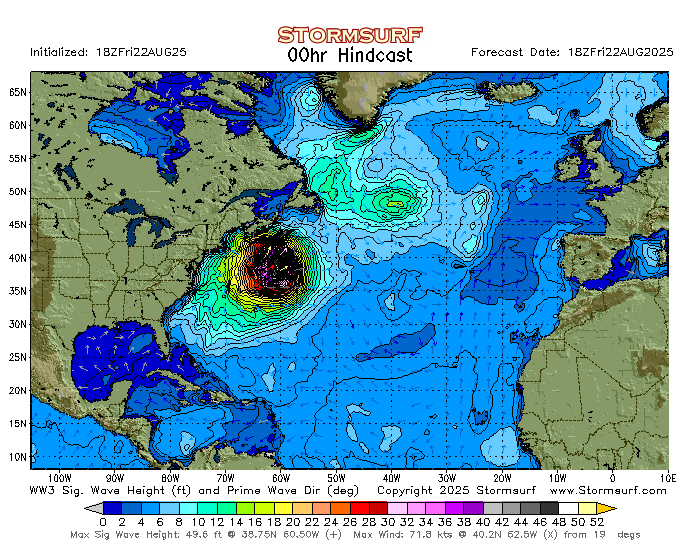
Global / Atlantic Wave Heights
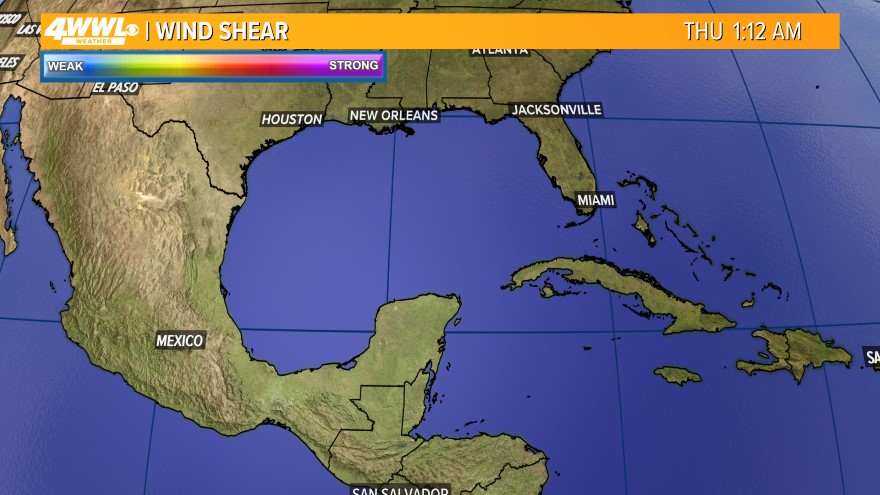
Current Wind Shear
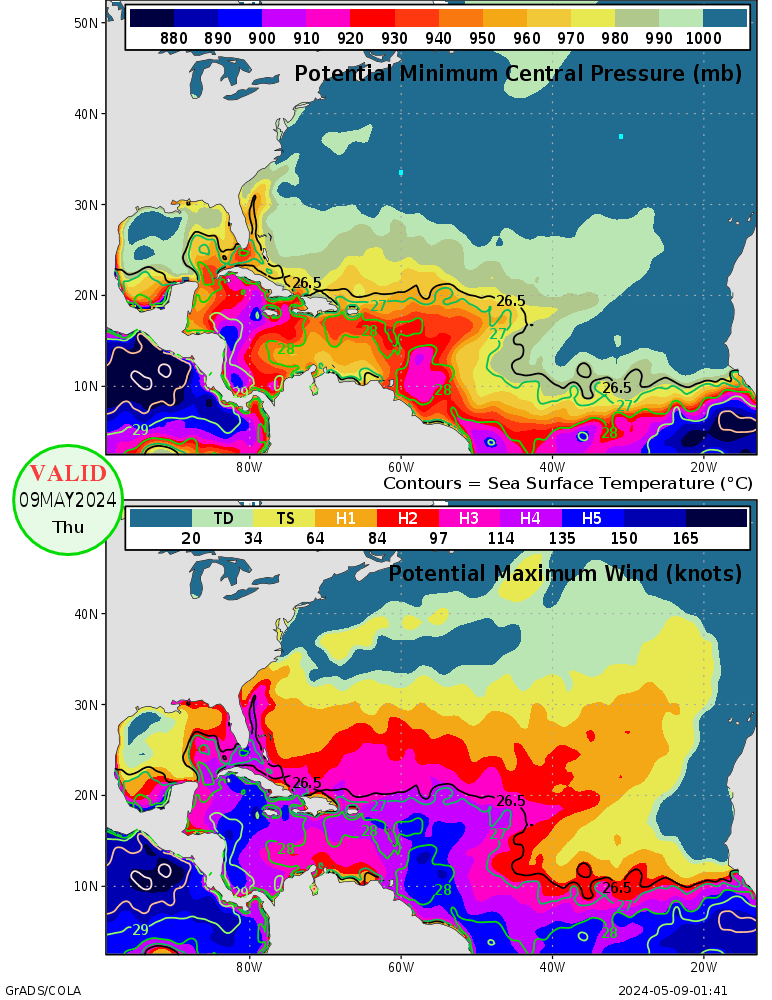
Maximum Potential Hurricane Intensity
Favorable Conditions for Development
12 Hour Forecast

24 Hour Forecast
48 Hour Forecast
72 Hour Forecast
24 Hour Forecast
48 Hour Forecast
72 Hour Forecast
Lookup Historic Hurricane Tracks

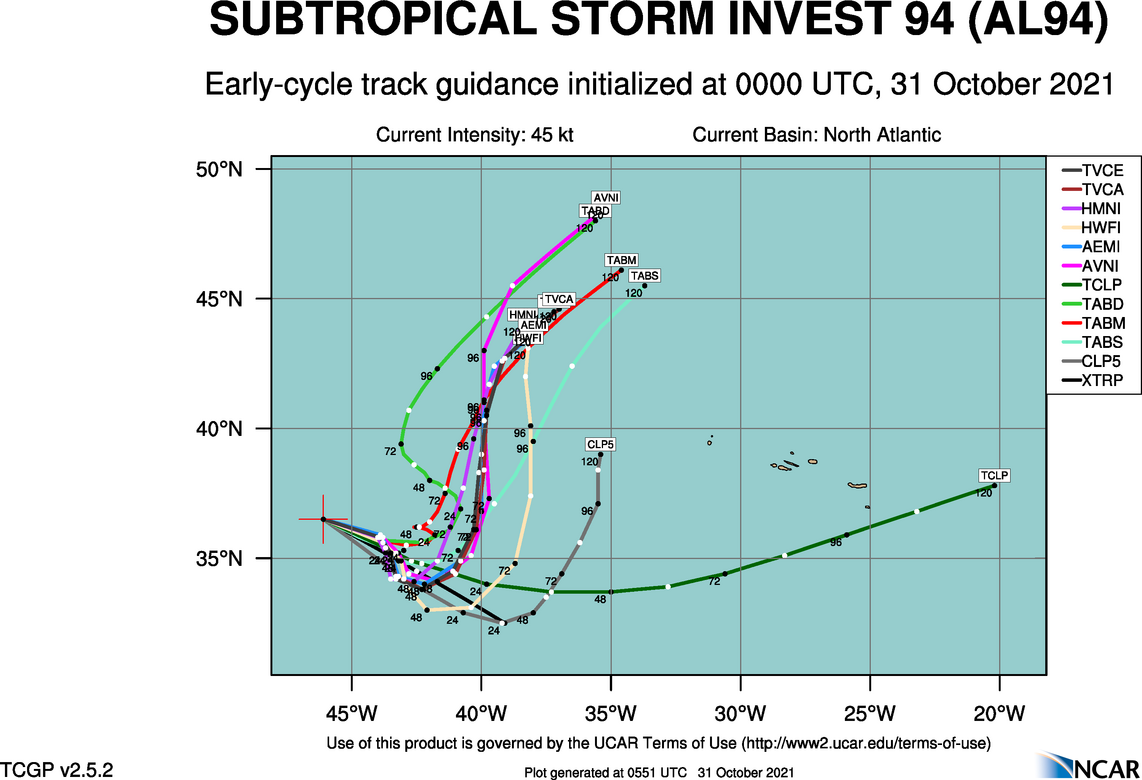
THREAT: Tracking Invest 94L
Quick Glance At The Tropics

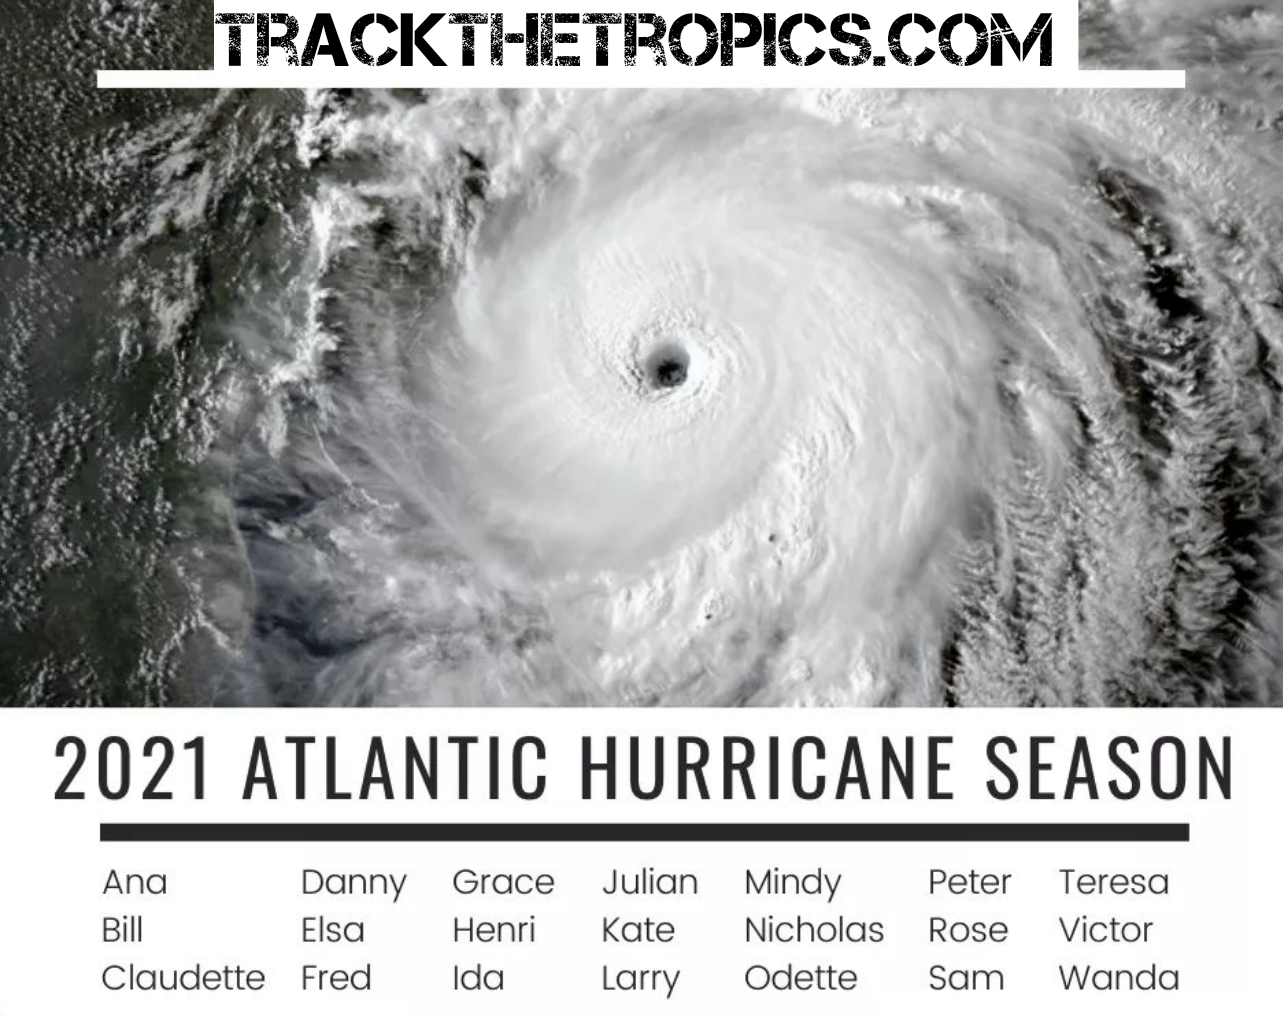
2021 Hurricane Season Tracks
Weather Forecasts
3 Day Loop
 Current Day 1 (Today)
 Current Day 2 (Tomorrow)
 Current Day 3
 Days 3 thru 7

Current Day 1 (Today)
Current Day 2 (Tomorrow)
Current Day 3
Days 3 thru 7
Surface Analysis Maps "The Big Picture"
Current Tropical Atlantic Analysis
Other Analysis Graphics
Other Analysis Graphics
10-Day GFS of 3-Hourly Precipitation
Global Forecast View
Current U.S. Jetstream

Future Shear Forecasts
24 hour
48 hour
72 hour
Future Shear Forecasts
24 hour
48 hour
72 hour
Current Vorticity
850mb
700mb
700mb
12Z Runs of TC Genesis Probability
Ensemble-based Probability (%) of TC Genesis Consensus (NCEP, CMC and ECMWF)
0-48 Hours 0-120 Hours
 120-240 Hours

0-48 Hours
0-120 Hours
120-240 Hours
Atlantic Satellite Loops
GEOColor IR

 Water Vapor
 Infrared
 Total Precipitable Water
 Water Vapor
 Infrared
 Total Precipitable Water
Caribbean Satellite Loops
GEOColor IR
 IR
IR
 Visible
 Water Vapor

GEOColor IR
 IR
IR
 Visible
 Water Vapor

Global Tropics Outlook
Current Wind / Wave Analysis
MJO Current State / Kelvin Wave
Future Surface Analysis Forecasts
24 Hour NHC Forecast
48 Hour NHC Forecast
72 Hour NHC Forecast
24 Hour NHC Forecast
48 Hour NHC Forecast

72 Hour NHC Forecast
El Niño/La Niña Oct 2020 Status (ENSO)
 Impacts of ENSO on Hurricane Season
Impacts of ENSO on Hurricane Season
Vertical Wind Shear

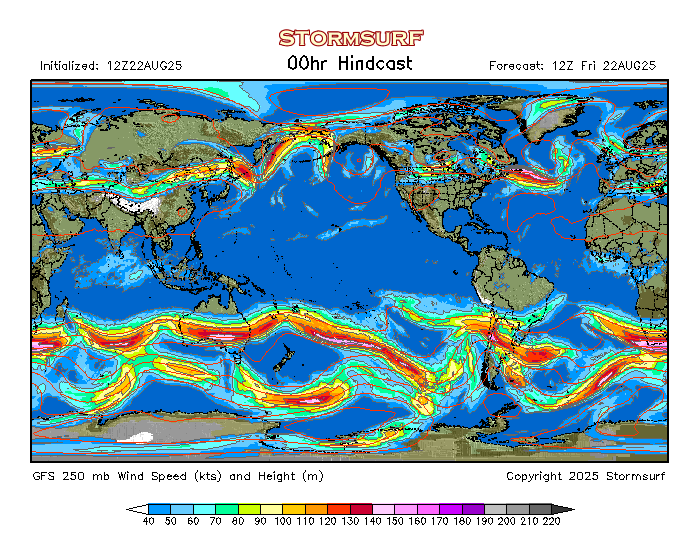
Global Jet Stream & 250 mb
Atlantic Sea Height / Waves