11 Visitors Tracking The Tropics!

PLEASE DONATE TO SUPPORT

This site is AD FREE so I rely on donations to keep it running. PLEASE if you appreciate my website and the information I provide then consider a one time or recurring donation!!
Donate

Track The Tropics has been the #1 source to track the tropics 24/7 since 2013! The main goal of the site is to bring all of the important links and graphics to ONE PLACE so you can keep up to date on any threats to land during the Atlantic Hurricane Season! Hurricane Season 2024 in the Atlantic starts on June 1st and ends on November 30th. Love Spaghetti Models? Well you've come to the right place!! Remember when you're preparing for a storm: Run from the water; hide from the wind!

Saffir-Simpson Hurricane Scale
Category Wind Speed Storm Surge
  mph ft
5 ≥157 >18
4 130–156 13–18
3 111–129 9–12
2 96–110 6–8
1 74–95 4–5
Additional Classifications
Tropical Storm 39–73 0–3
Tropical Depression 0–38 0
The Saffir-Simpson Hurricane Scale is a classification used for most Western Hemisphere tropical cyclones that exceed the intensities of "tropical depressions" and "tropical storms", and thereby become hurricanes. Source: Intellicast

Hurricane Season 101

The official Atlantic Basin Hurricane Season runs from June 1st to November 30th. A tropical cyclone is a warm-core, low pressure system without any “front” attached. It develops over tropical or subtropical waters, and has an organized circulation. Depending upon location, tropical cyclones have different names around the world. The Tropical Cyclones we track in the Atlantic basin are called Tropical Depressions, Tropical Storms and Hurricanes! Atlantic Basin Tropical Cyclones are classified as follows: Tropical Depression: Organized system of clouds and thunderstorms with defined surface circulation and max sustained winds of 38 mph or less. Tropical Storm: Organized system of strong thunderstorms with a defined surface circulation and maximum sustained winds of 39-73 mph. Hurricane: Intense tropical weather system of strong thunderstorms with a well-defined surface circulation. A Hurricane has max sustained winds of 74 mph or higher!

The difference between Tropical Storm and Hurricane Watches, Warnings, Advisories and Outlooks

Warnings:Listen closely to instructions from local officials on TV, radio, cell phones or other computers for instructions from local officials.Evacuate immediately if told to do so.
  • Storm Surge Warning: There is a danger of life-threatening inundation from rising water moving inland from the shoreline somewhere within the specified area. This is generally within 36 hours. If you are under a storm surge warning, check for evacuation orders from your local officials.
  • Hurricane Warning: Hurricane conditions (sustained winds of 74 mph or greater) are expected somewhere within the specified area. NHC issues a hurricane warning 36 hours in advance of tropical storm-force winds to give you time to complete your preparations. All preparations should be complete. Evacuate immediately if so ordered.
  • Tropical Storm Warning: Tropical storm conditions (sustained winds of 39 to 73 mph) are expected within your area within 36 hours.
  • Extreme Wind Warning: Extreme sustained winds of a major hurricane (115 mph or greater), usually associated with the eyewall, are expected to begin within an hour. Take immediate shelter in the interior portion of a well-built structure.
Please note that hurricane and tropical storm watches and warnings for winds on land as well as storm surge watches and warnings can be issued for storms that the NWS believes will become tropical cyclones but have not yet attained all of the characteristics of a tropical cyclone (i.e., a closed low-level circulation, sustained thunderstorm activity, etc.). In these cases, the forecast conditions on land warrant alerting the public. These storms are referred to as “potential tropical cyclones” by the NWS. Hurricane, tropical storm, and storm surge watches and warnings can also be issued for storms that have lost some or all of their tropical cyclone characteristics, but continue to produce dangerous conditions. These storms are called “post-tropical cyclones” by the NWS. Watches: Listen closely to instructions from local officials on TV, radio, cell phones or other computers for instructions from local officials. Evacuate if told to do so.
  • Storm Surge Watch: Storm here is a possibility of life-threatening inundation from rising water moving inland from the shoreline somewhere within the specified area, generally within 48 hours. If you are under a storm surge watch, check for evacuation orders from your local officials.
  • Hurricane Watch: Huriricane conditions (sustained winds of 74 mph or greater) are possible within your area. Because it may not be safe to prepare for a hurricane once winds reach tropical storm force, The NHC issues hurricane watches 48 hours before it anticipates tropical storm-force winds.
  • Tropical Storm Watch: Tropical storm conditions (sustained winds of 39 to 73 mph) are possible within the specified area within 48 hours.
Advisories:
  • Tropical Cyclone Public Advisory:The Tropical Cyclone Public Advisory contains a list of all current coastal watches and warnings associated with an ongoing or potential tropical cyclone, a post-tropical cyclone, or a subtropical cyclone. It also provides the cyclone position, maximum sustained winds, current motion, and a description of the hazards associated with the storm.
  • Tropical Cyclone Track Forecast Cone:This graphic shows areas under tropical storm and hurricane watches and warnings, the current position of the center of the storm, and its predicted track. Forecast uncertainty is conveyed on the graphic by a “cone” (white and stippled areas) drawn such that the center of the storm will remain within the cone about 60 to 70 percent of the time. Remember, the effects of a tropical cyclone can span hundreds of miles. Areas well outside of the cone often experience hazards such as tornadoes or inland flooding from heavy rain.
Outlooks:
  • Tropical Weather Outlook:The Tropical Weather Outlook is a discussion of significant areas of disturbed weather and their potential for development during the next 5 days. The Outlook includes a categorical forecast of the probability of tropical cyclone formation during the first 48 hours and during the entire 5-day forecast period. You can also find graphical versions of the 2-day and 5-day Outlook here
Be sure to read up on tons of more information on Hurricane knowledge, preparedness, statistics and history under the menu on the left hand side of the page! Here are your 2020 Hurricane Season Names: Arthur, Bertha, Cristobal, Dolly, Edouard, Fay, Gonzalo, Hanna, Isaias, Josephine ,Kyle, Laura, Marco, Nana, Omar, Paulette, Rene, Sally, Teddy, Vicky and Wilfred!!!

TrackTheTropics Resource Links

CONUS Hurricane Strikes

1950-2017
[Map of 1950-2017 CONUS Hurricane Strikes]
Total Hurricane Strikes 1900-2010 Total Hurricane Strikes 1900-2010 Total MAJOR Hurricane Strikes 1900-2010 Total Major Hurricane Strikes 1900-2010 Western Gulf Hurricane Strikes Western Gulf Hurricane Strikes Western Gulf MAJOR Hurricane Strikes Western Gulf Major Hurricane Strikes Eastern Gulf Hurricane Strikes Eastern Gulf Hurricane Strikes Eastern Gulf MAJOR Hurricane Strikes Eastern Gulf Major Hurricane Strikes SE Coast Hurricane Strikes SE Coast Hurricane Strikes SE Coast MAJOR Hurricane Strikes SE Coast Major Hurricane Strikes NE Coast Hurricane Strikes NE Coast Hurricane Strikes NE Coast MAJOR Hurricane Strikes NE Coast Major Hurricane Strikes

Hurricane Season Statistics

Overview

A tropical cyclone is a rotating, organized system of clouds and thunderstorms that originates over tropical or subtropical waters and has a closed low-level circulation. Tropical cyclones rotate counterclockwise in the Northern Hemisphere. They are classified as follows:

  • Tropical Depression: A tropical cyclone with maximum sustained winds of 38 mph (33 knots) or less.
  • Tropical Storm: A tropical cyclone with maximum sustained winds of 39 to 73 mph (34 to 63 knots).
  • Hurricane: A tropical cyclone with maximum sustained winds of 74 mph (64 knots) or higher. In the western North Pacific, hurricanes are called typhoons; similar storms in the Indian Ocean and South Pacific Ocean are called cyclones.
  • Major Hurricane: A tropical cyclone with maximum sustained winds of 111 mph (96 knots) or higher, corresponding to a Category 3, 4 or 5 on the Saffir-Simpson Hurricane Wind Scale.

The Atlantic hurricane season runs from June 1st to November 30th. The Atlantic basin includes the Atlantic Ocean, Caribbean Sea, and Gulf of Mexico.

[graph of average cumulative number of Atlantic basin systems per year]

The average cumulative number of Atlantic systems per year, 1966-2009

Number of Tropical Cyclones per 100 Years


Peak Of Season

The official hurricane season for the Atlantic Basin (the Atlantic Ocean, the Caribbean Sea, and the Gulf of Mexico) is from 1 June to 30 November. As seen in the graph above, the peak of the season is from mid-August to late October. However, deadly hurricanes can occur anytime in the hurricane season.

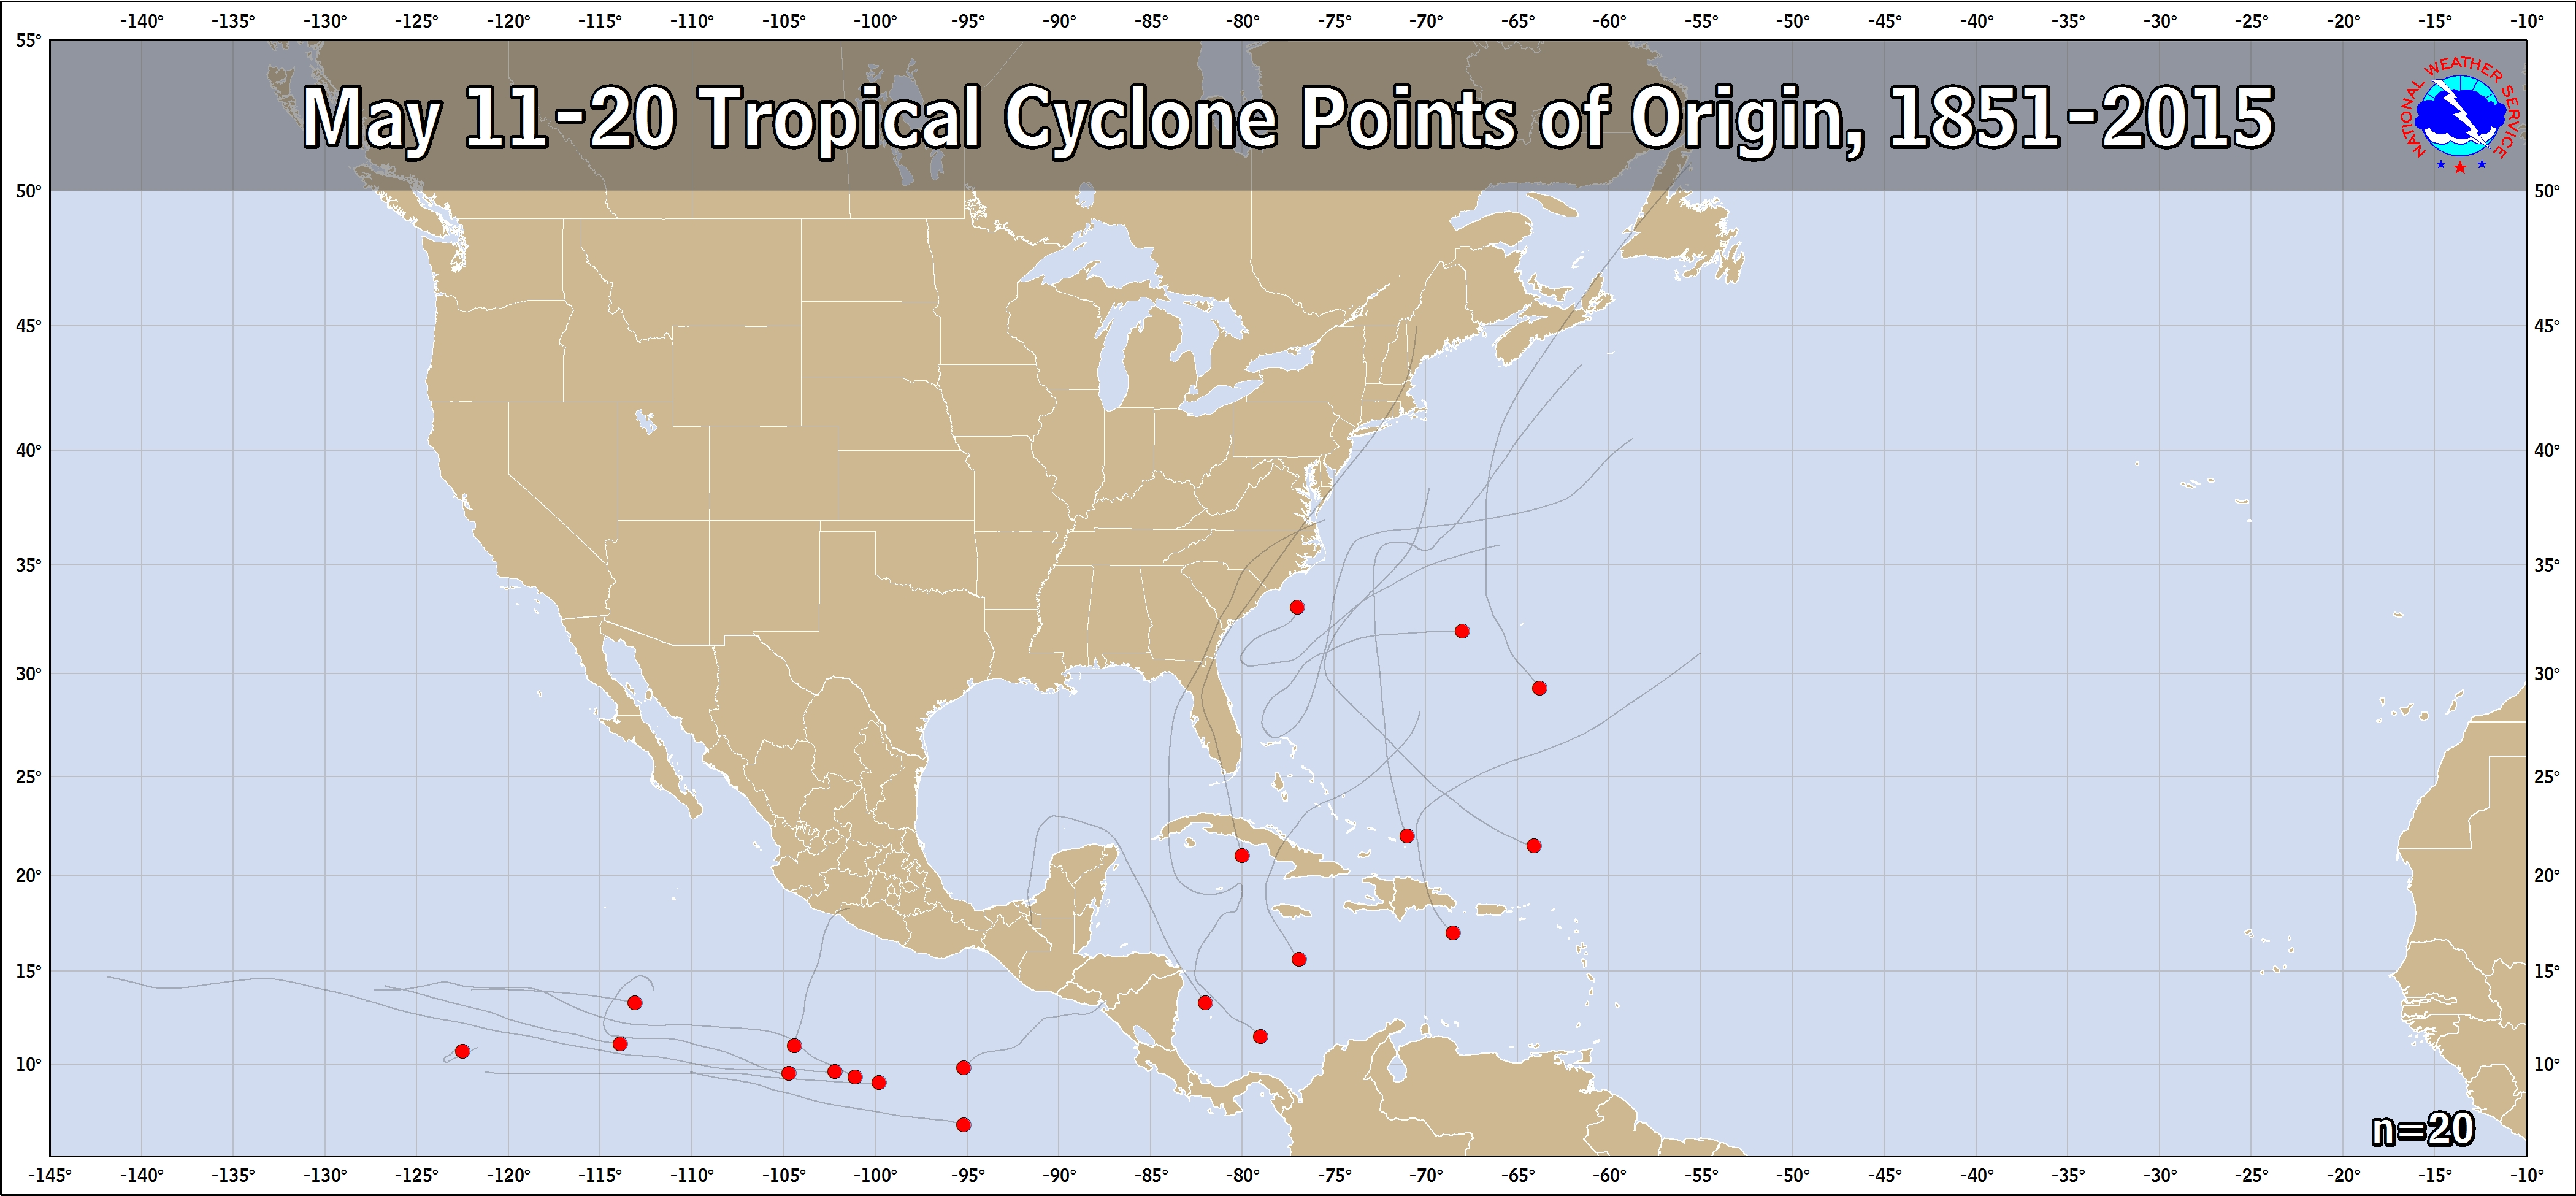
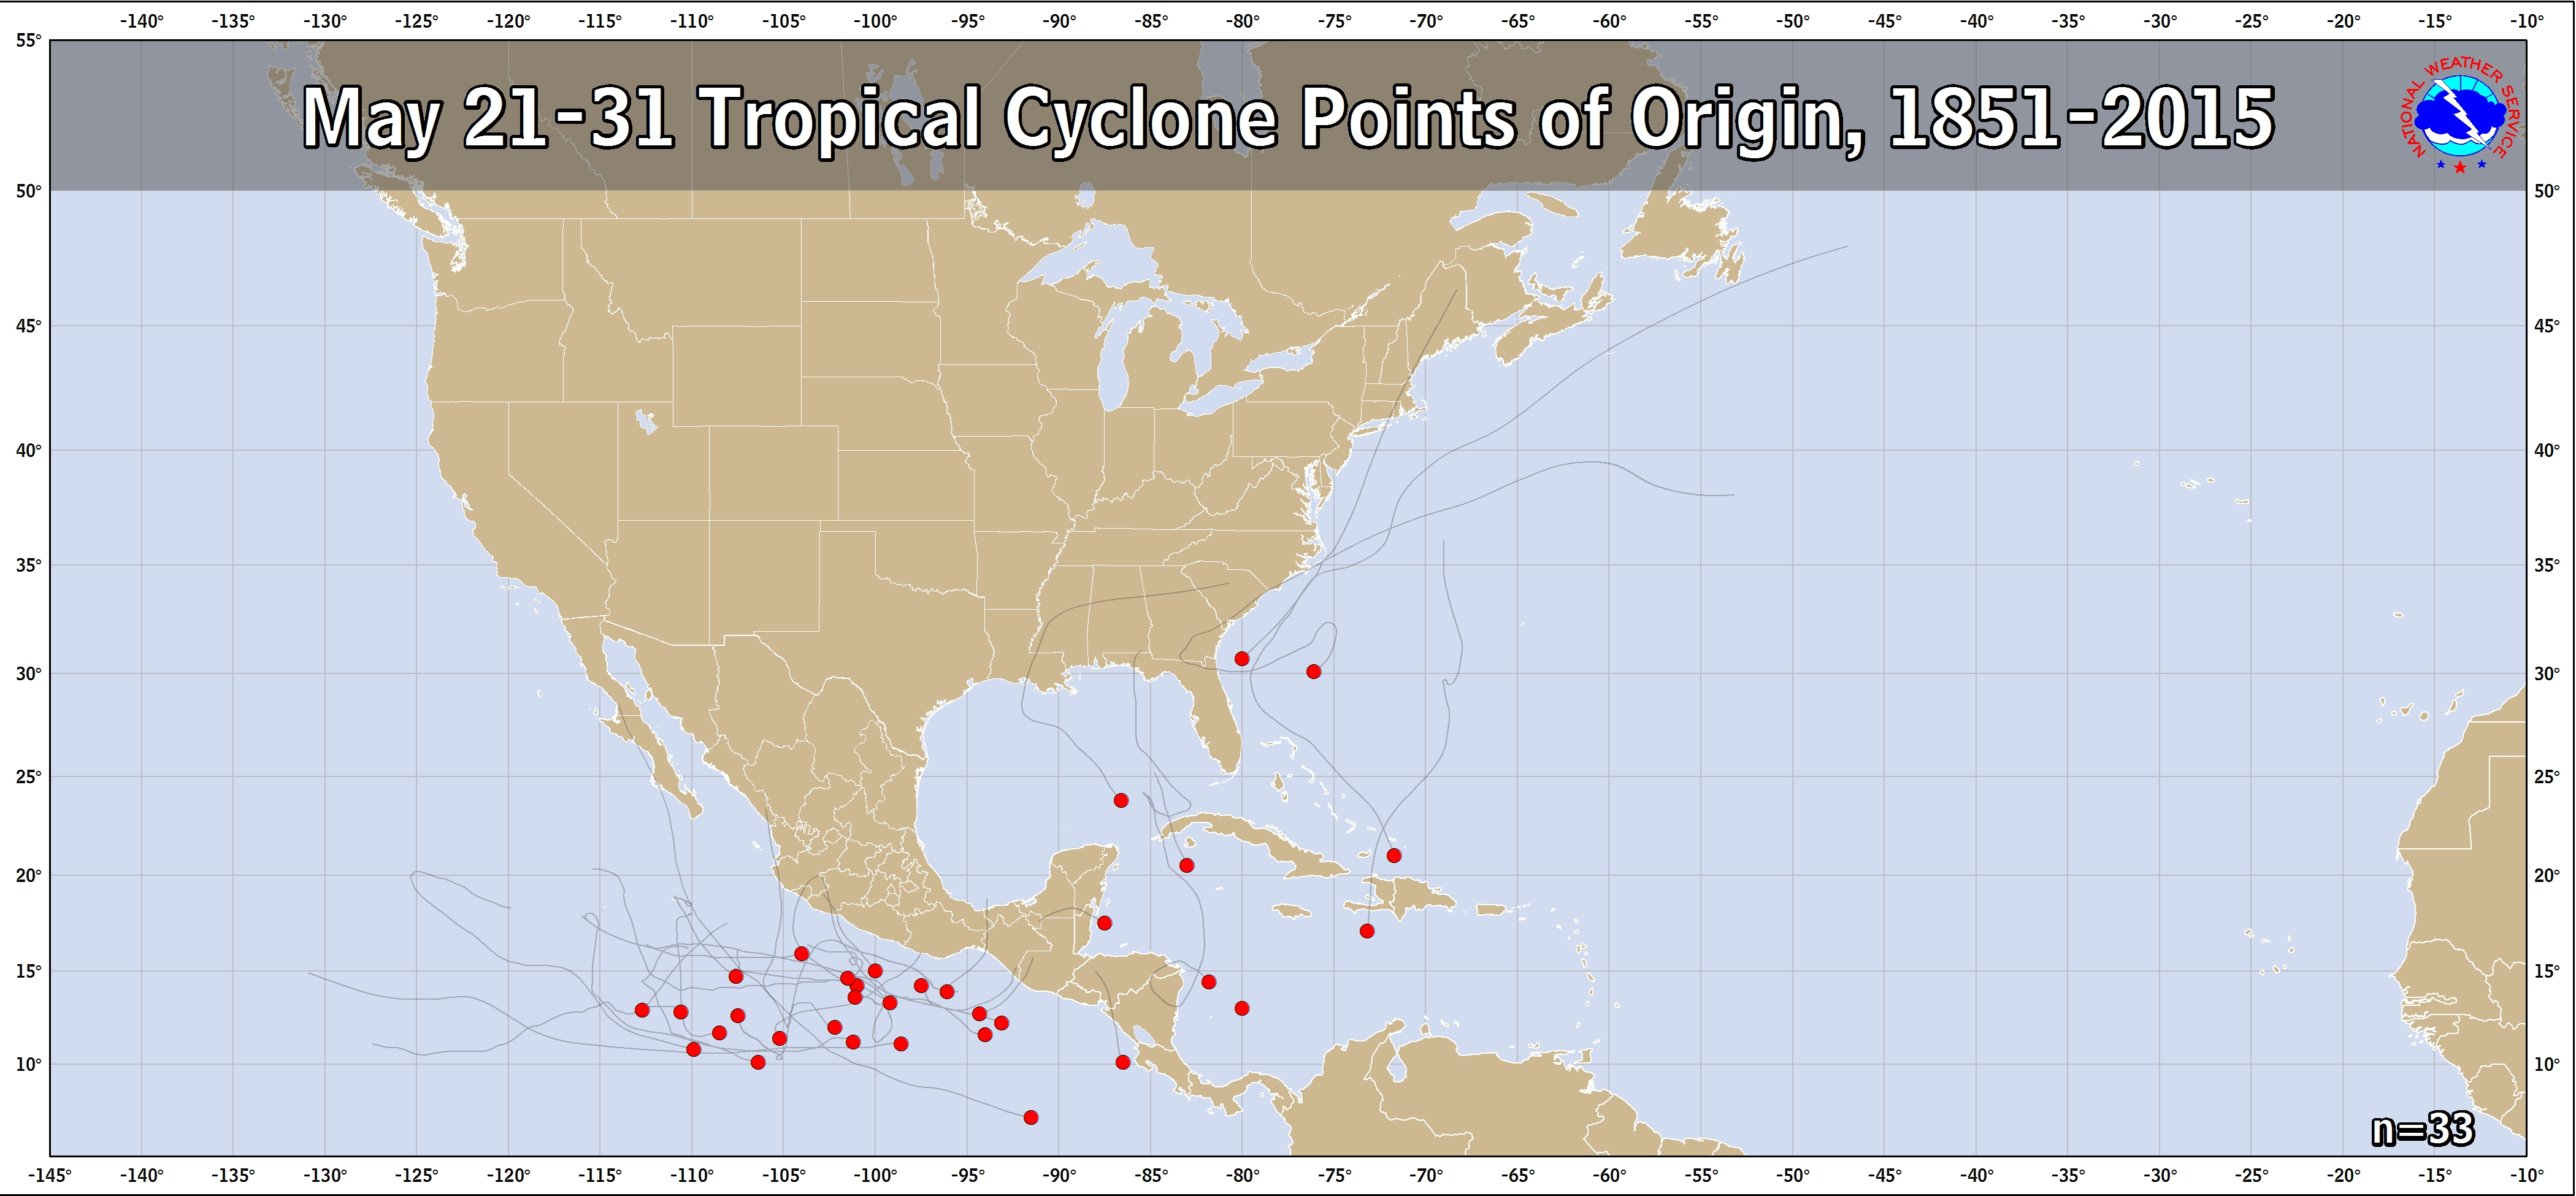
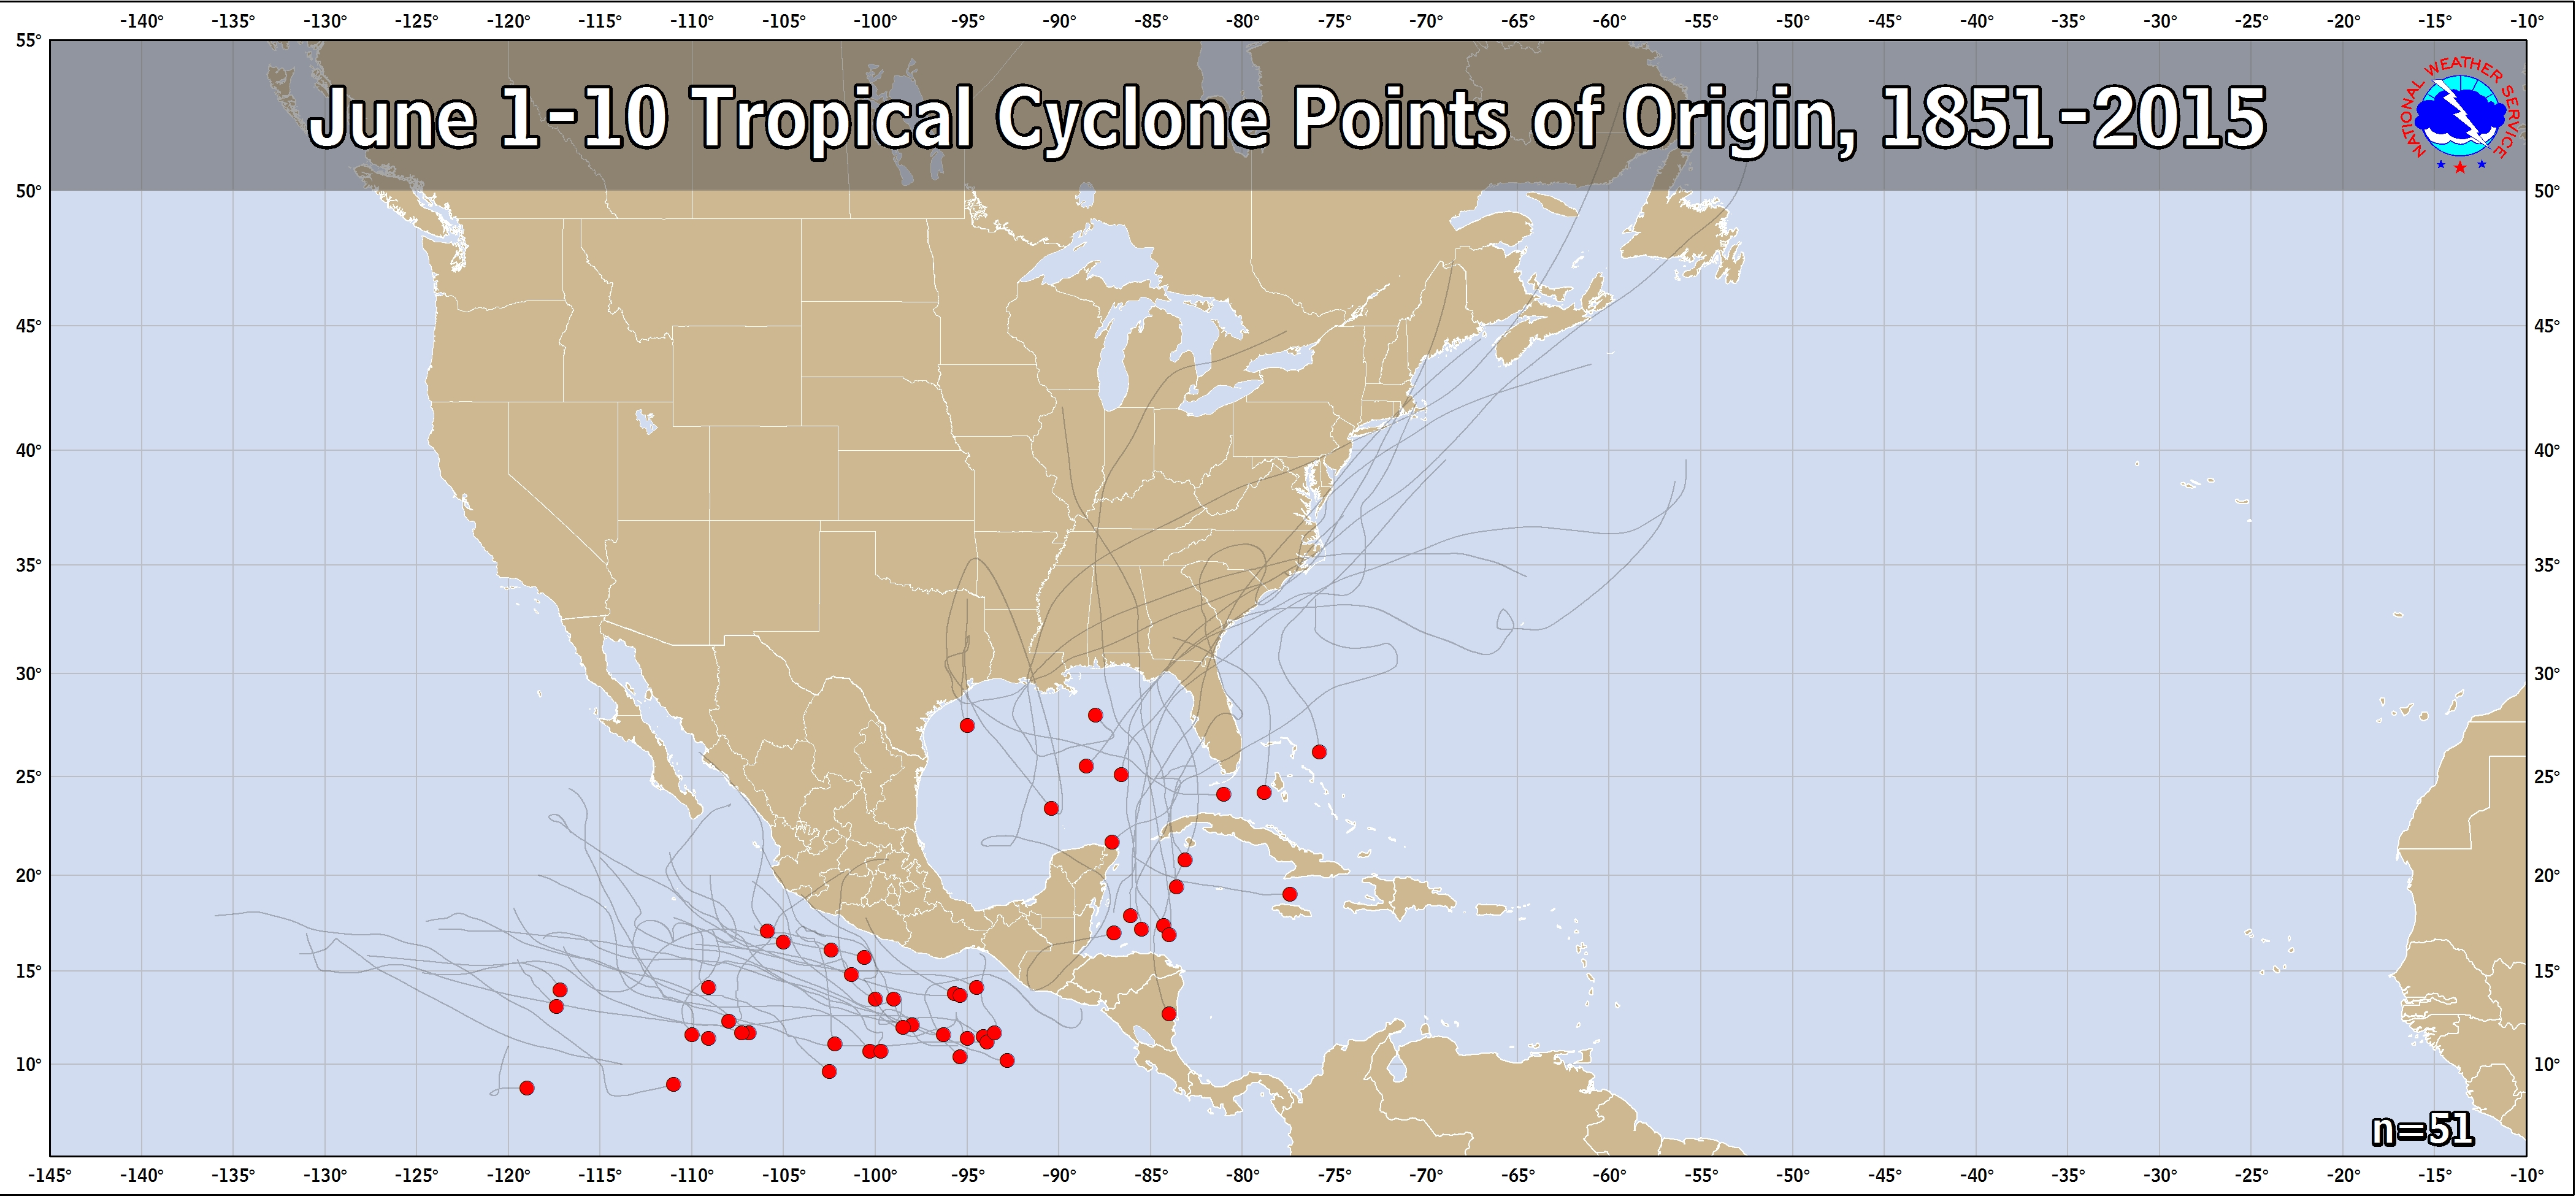
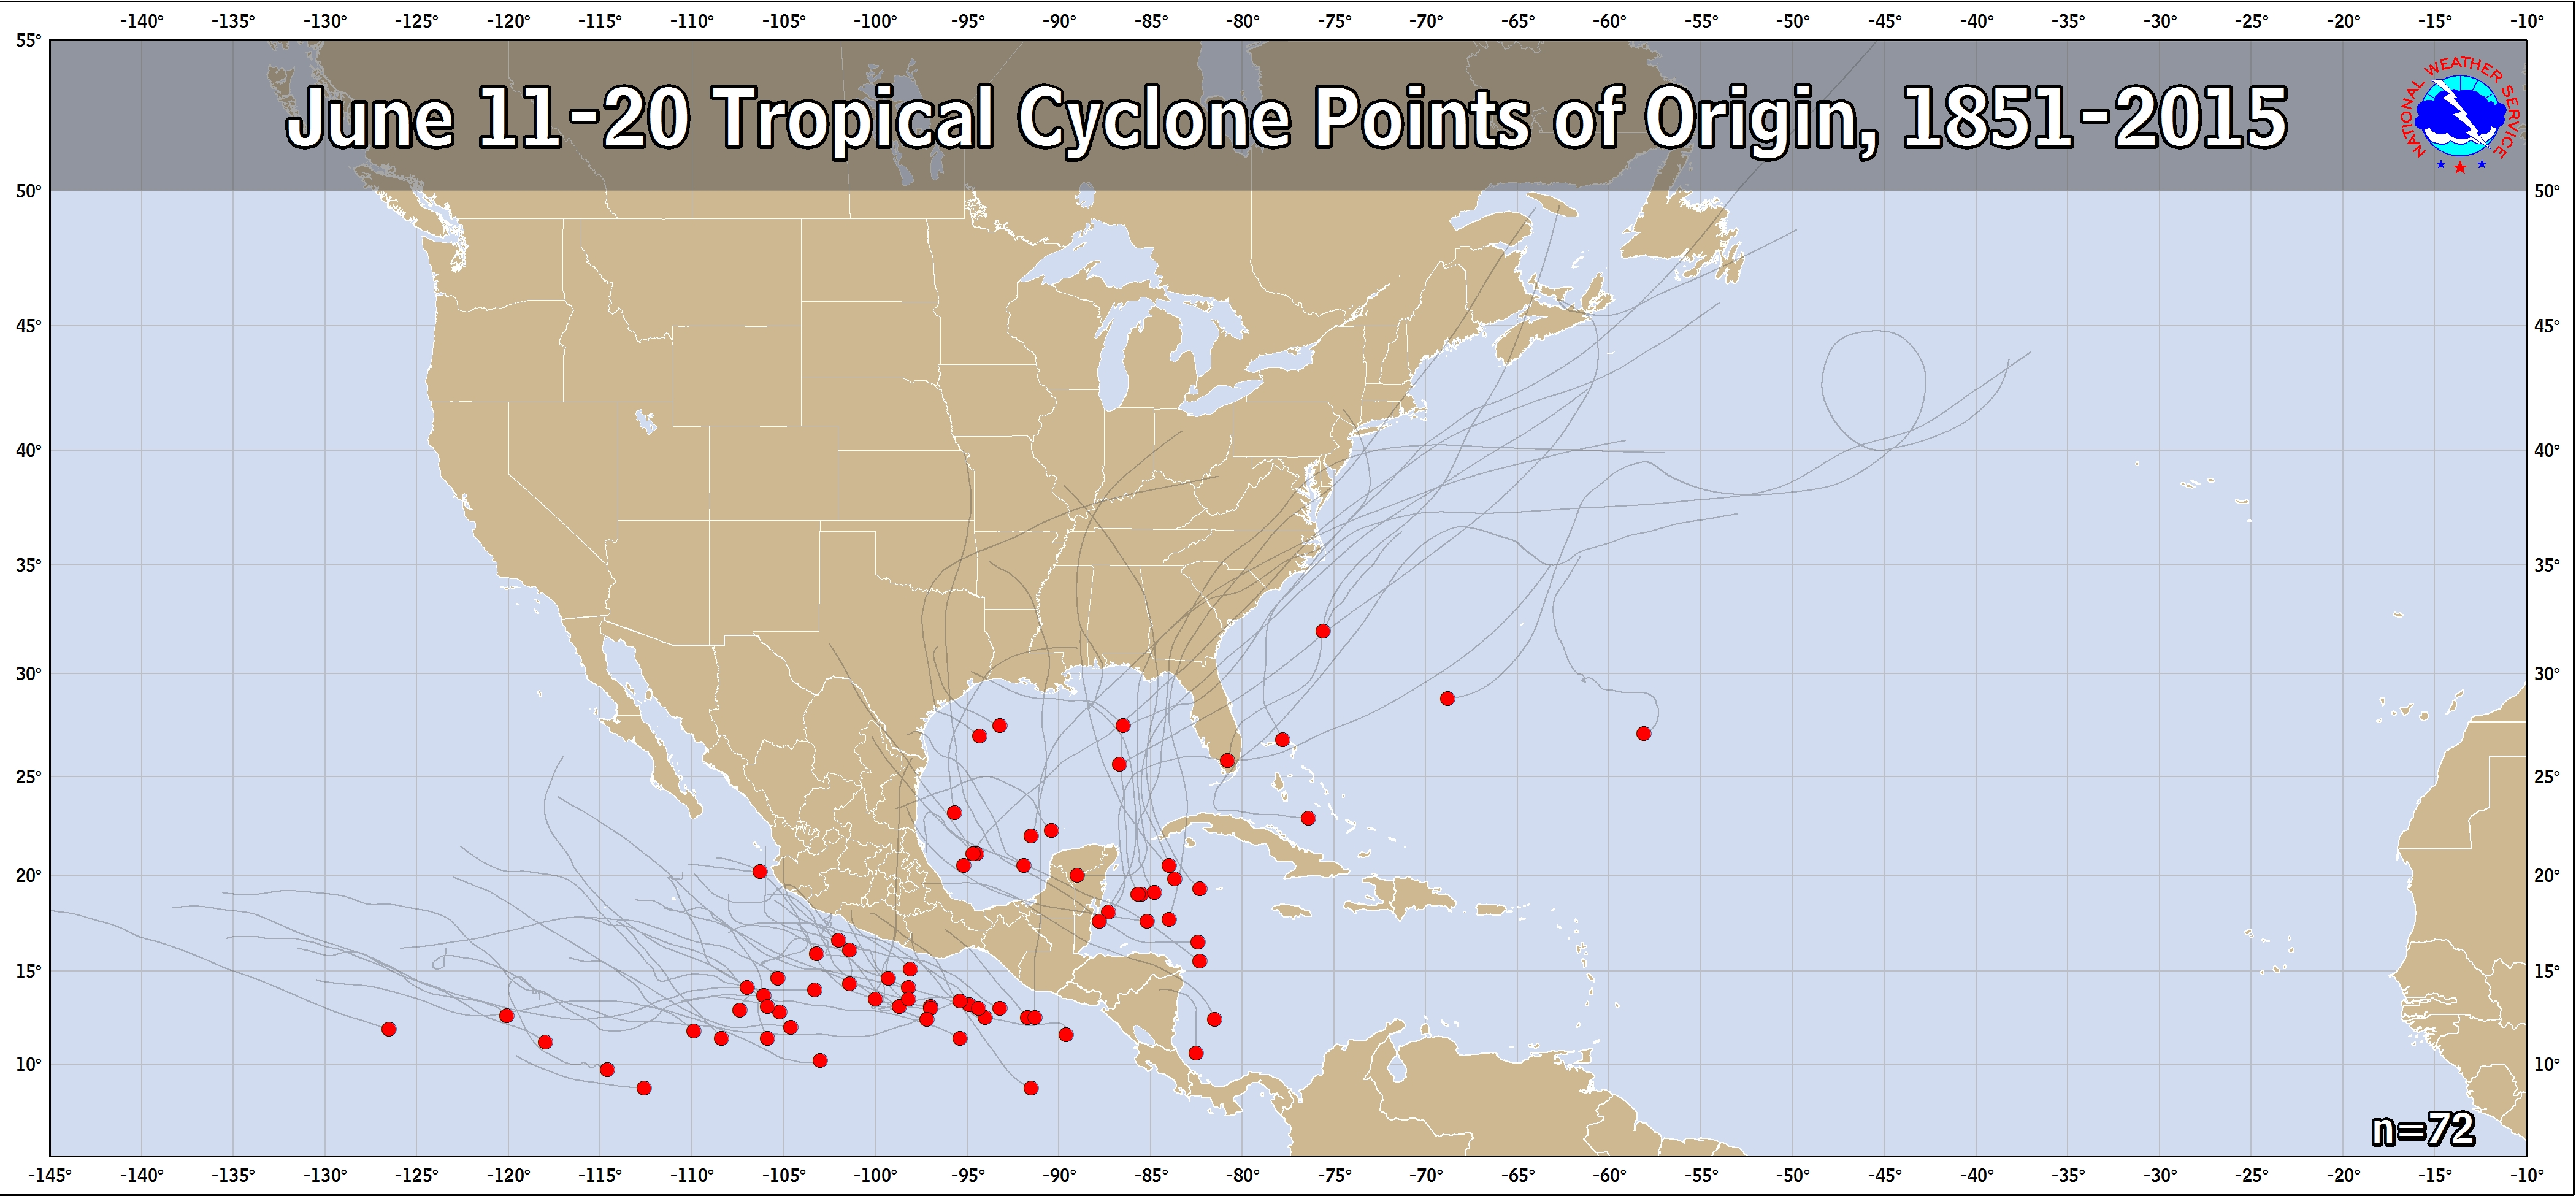
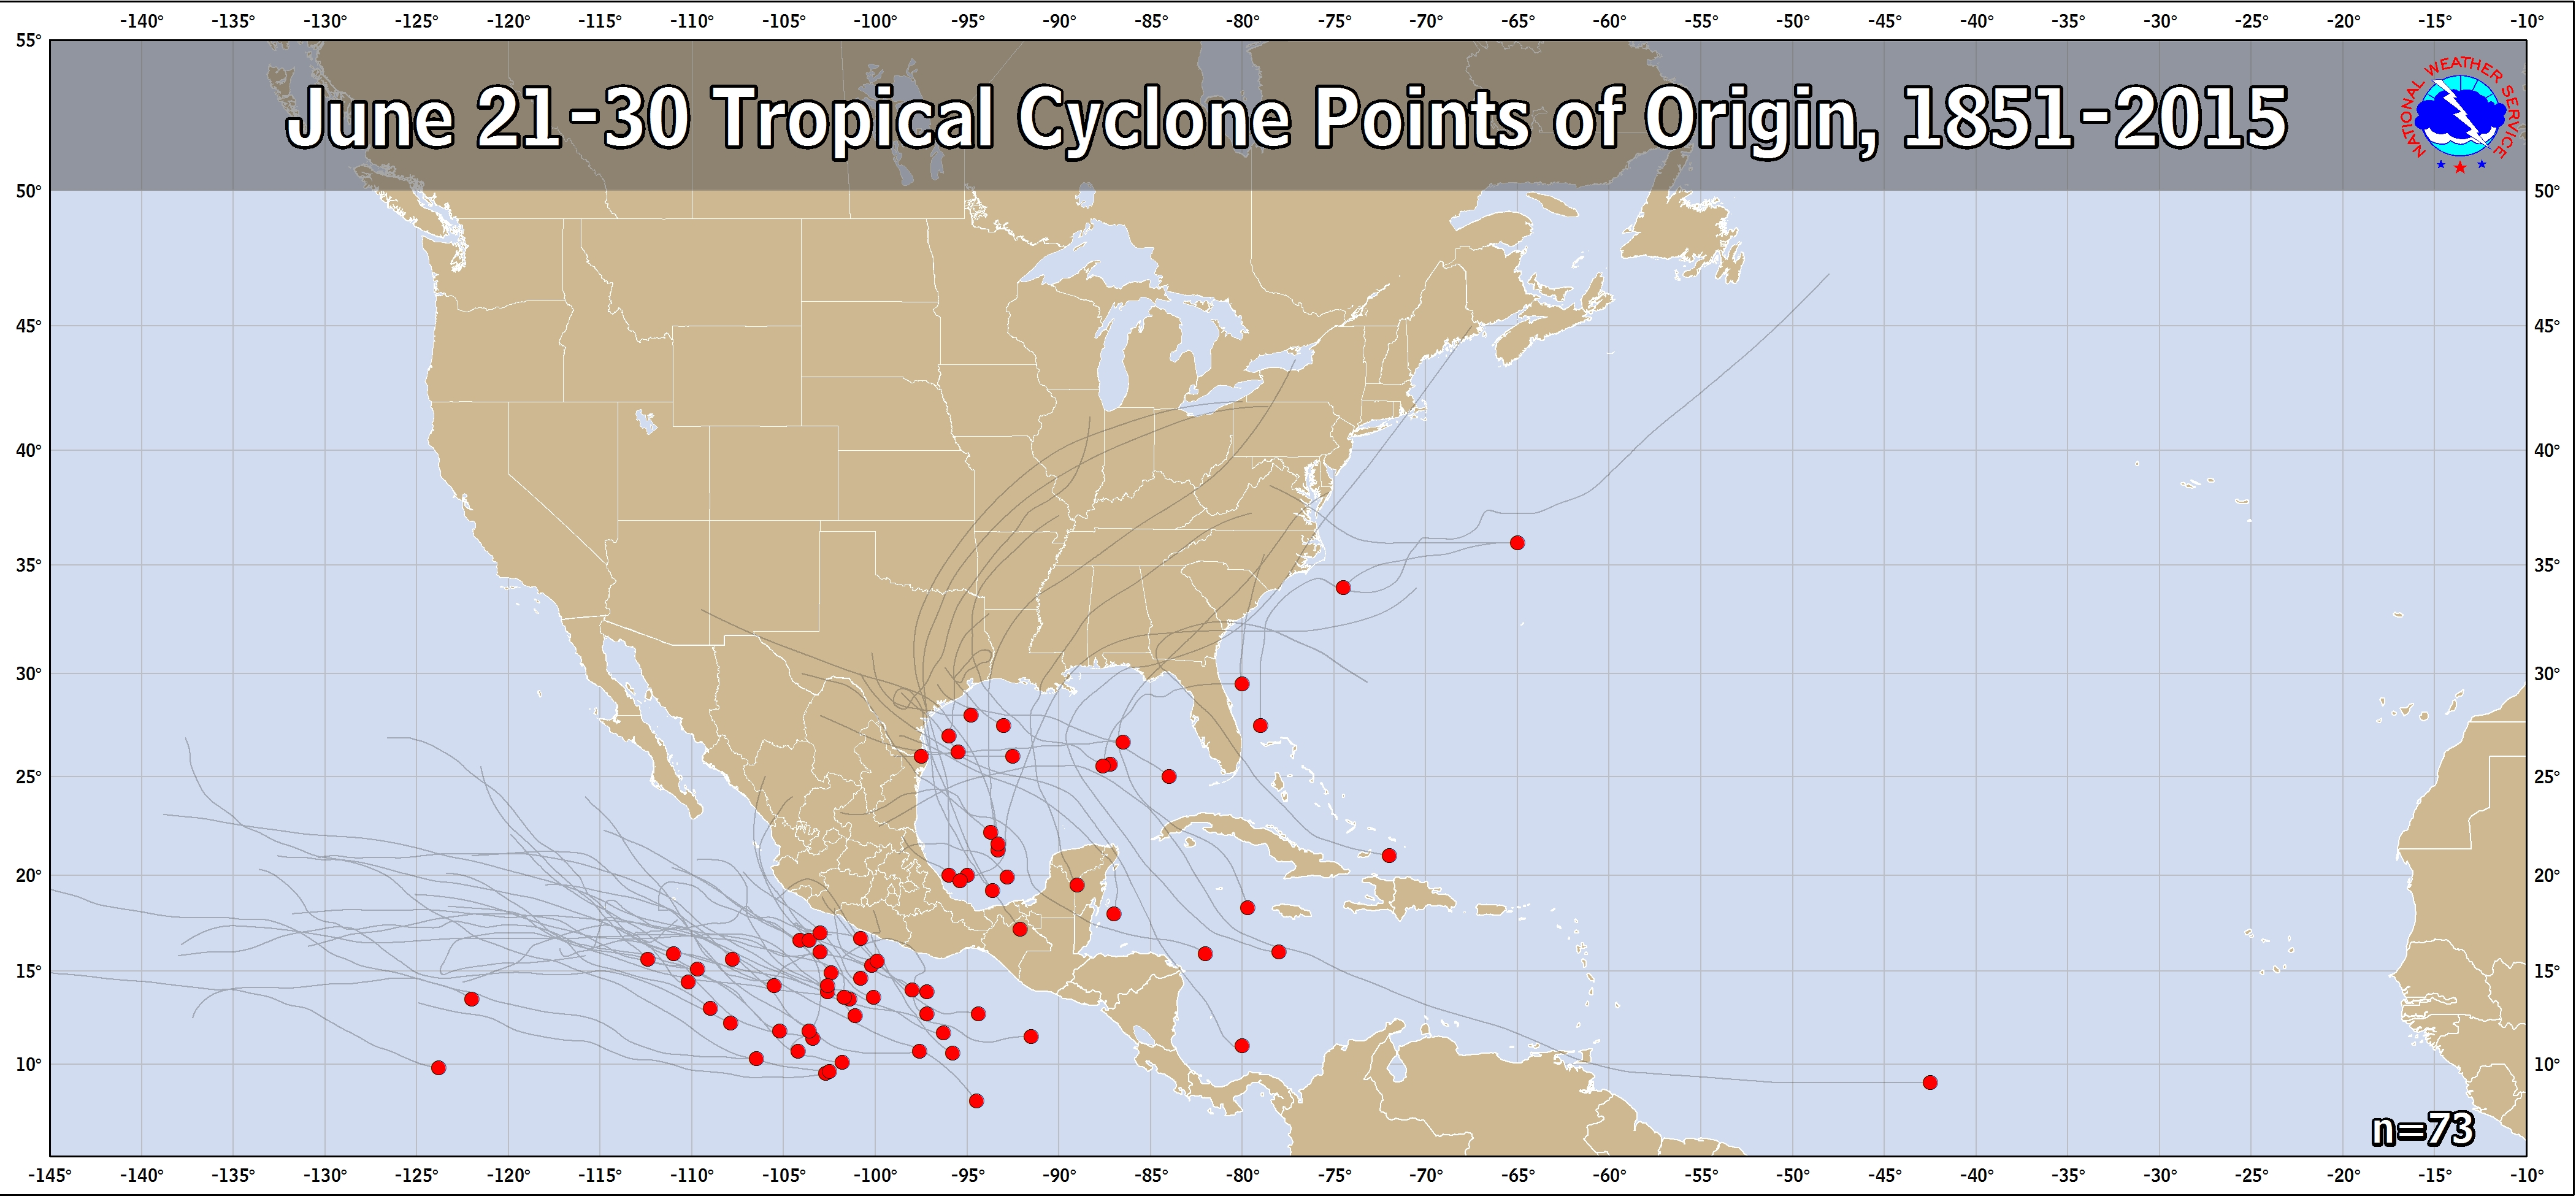
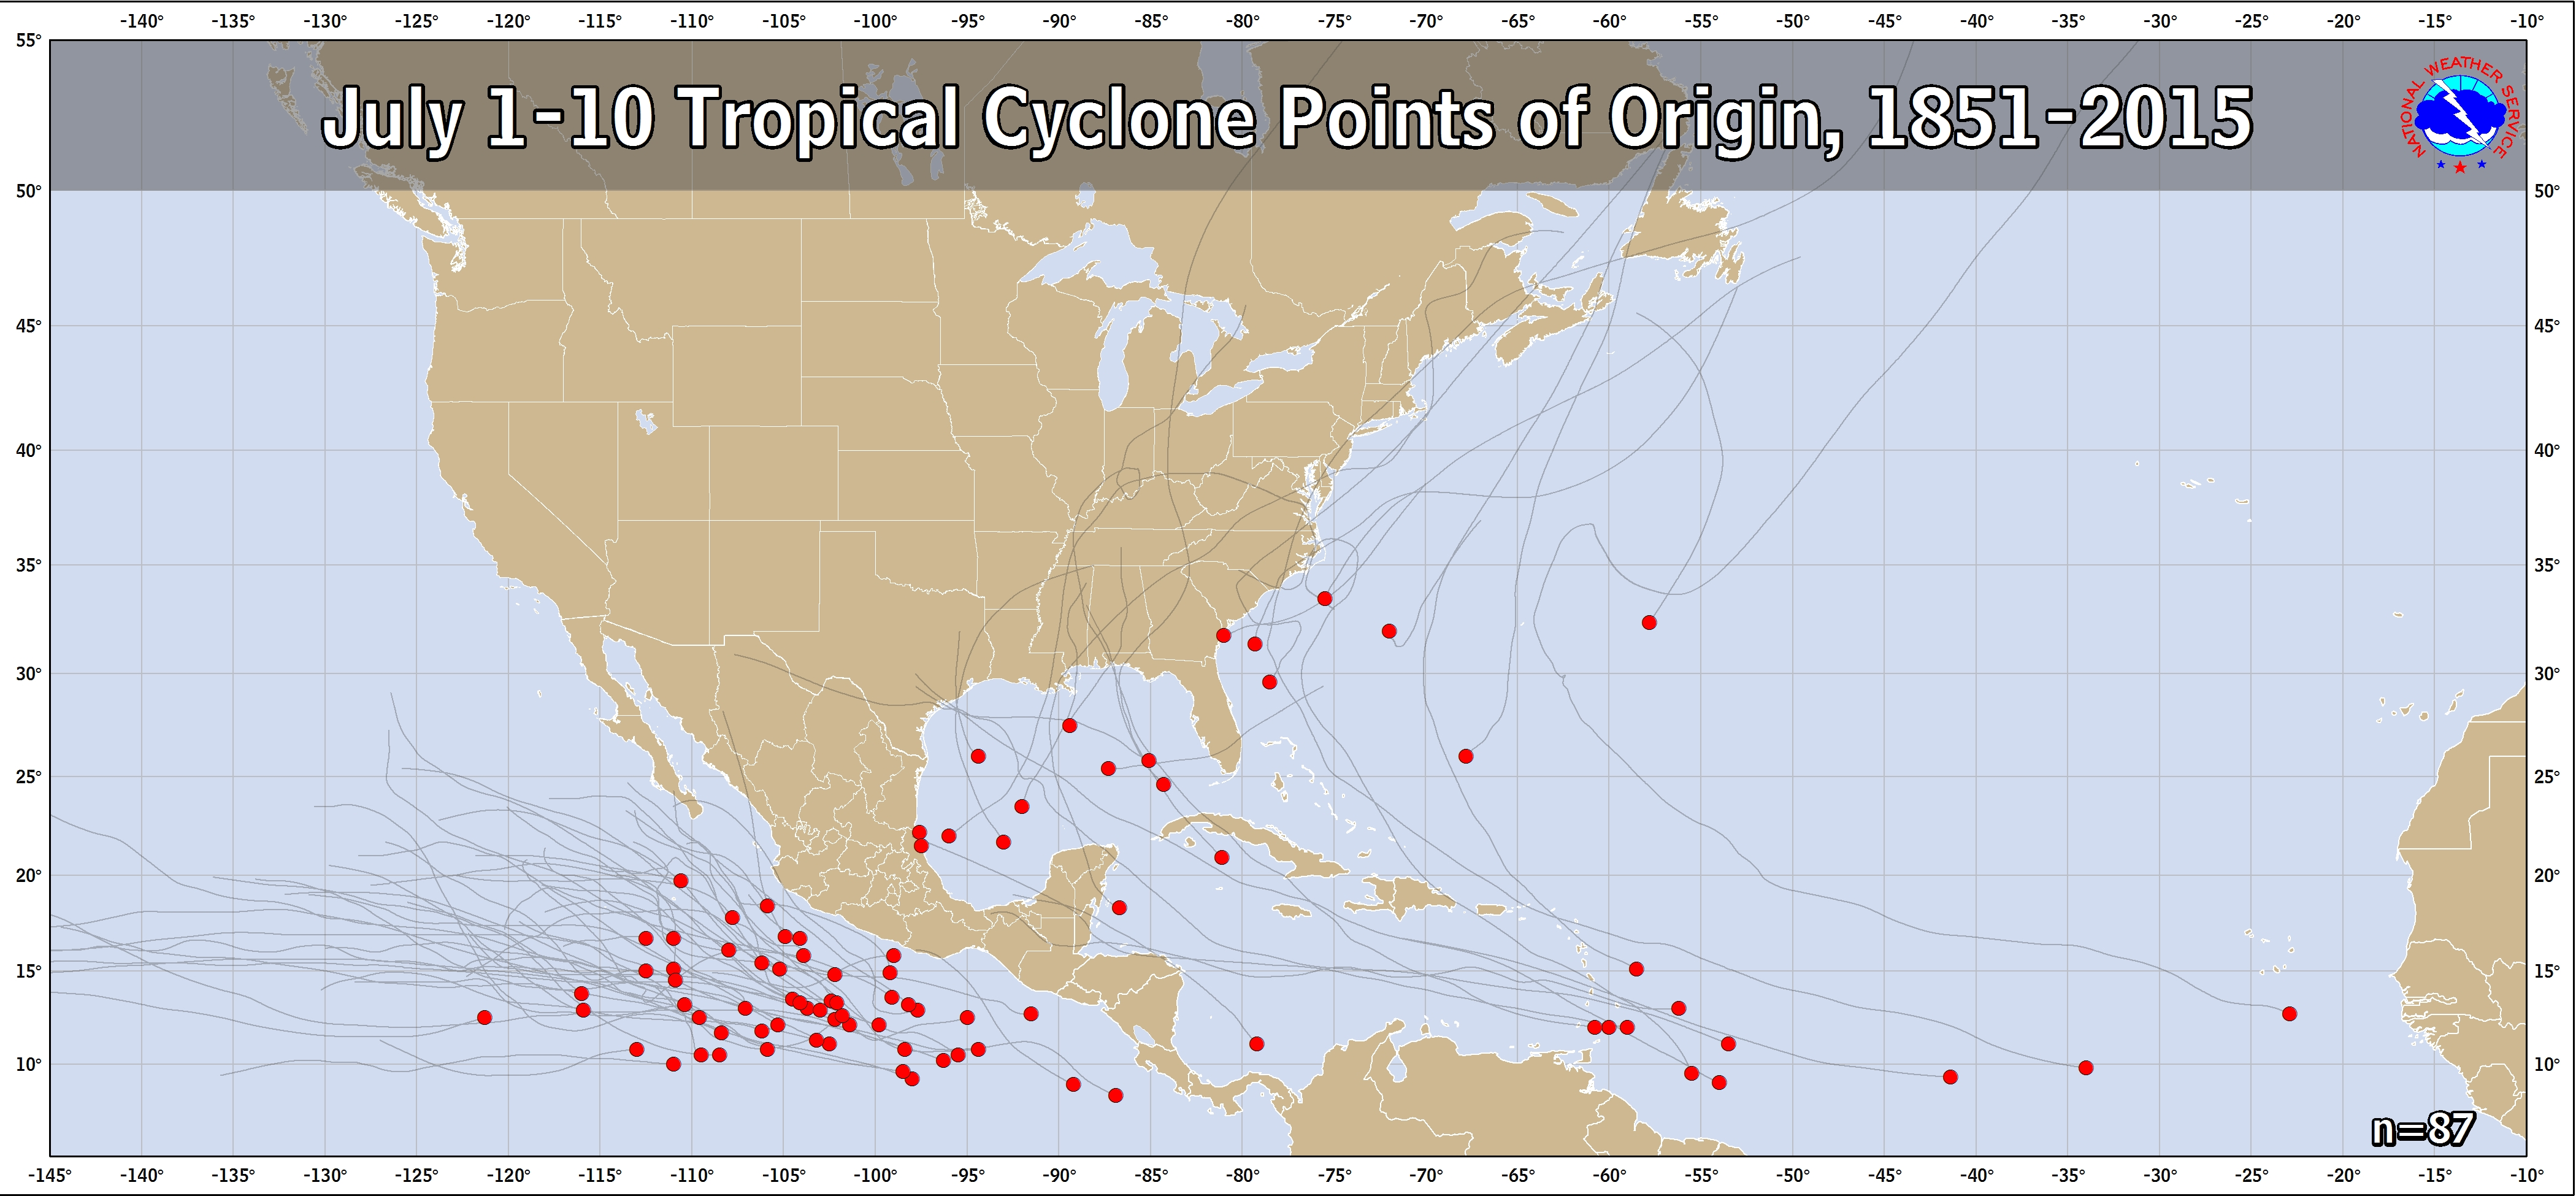
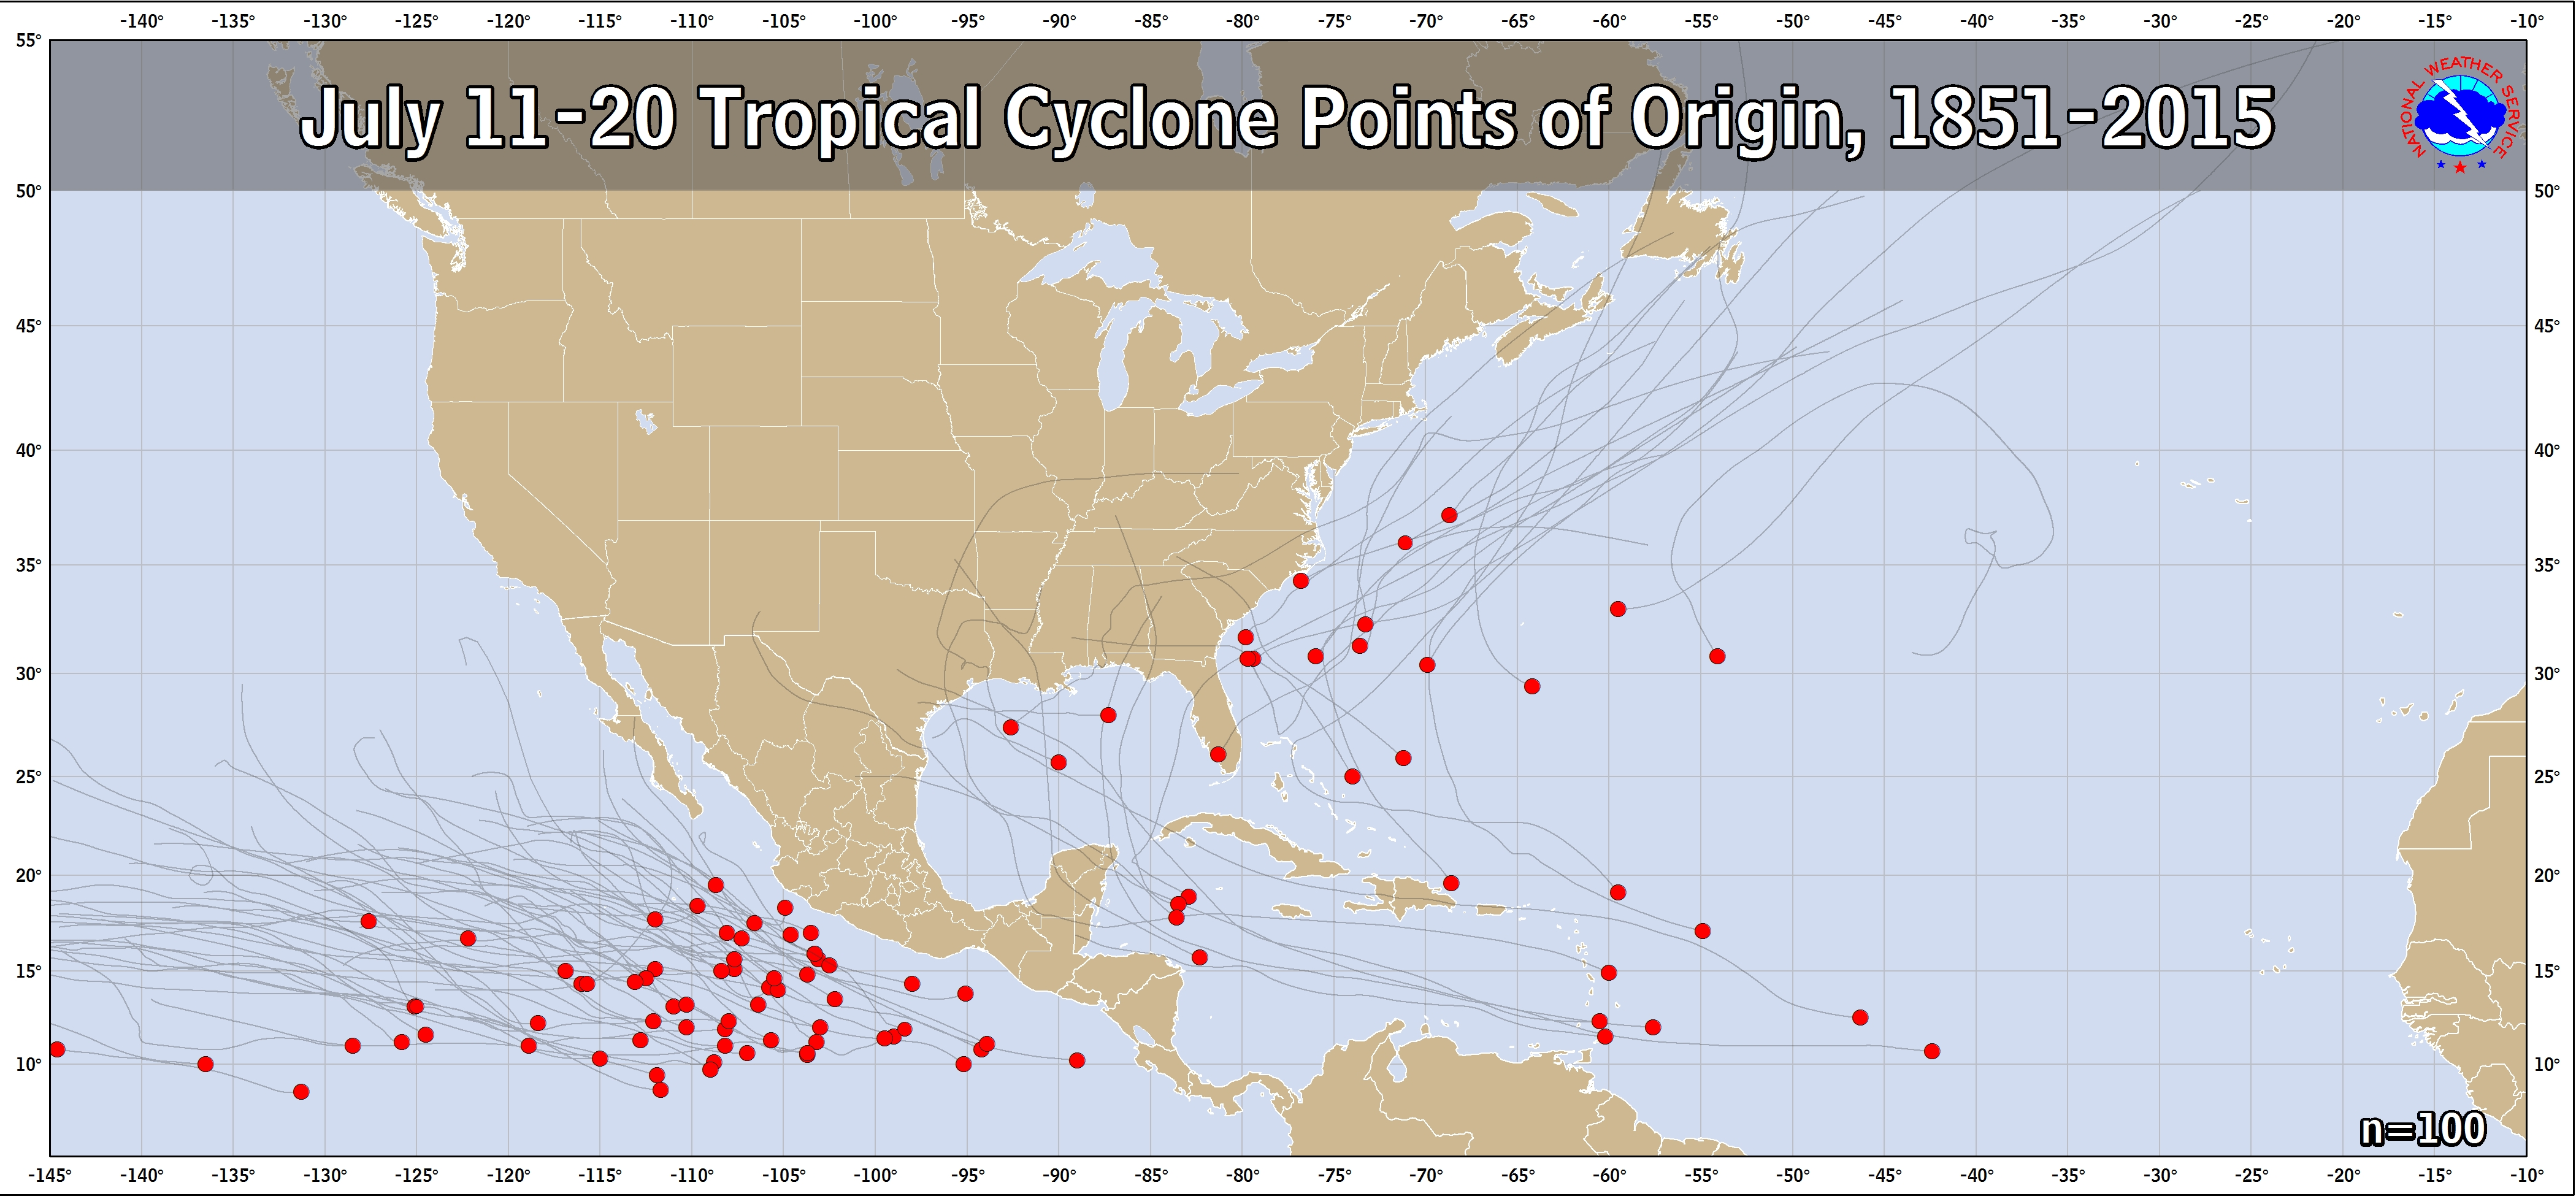
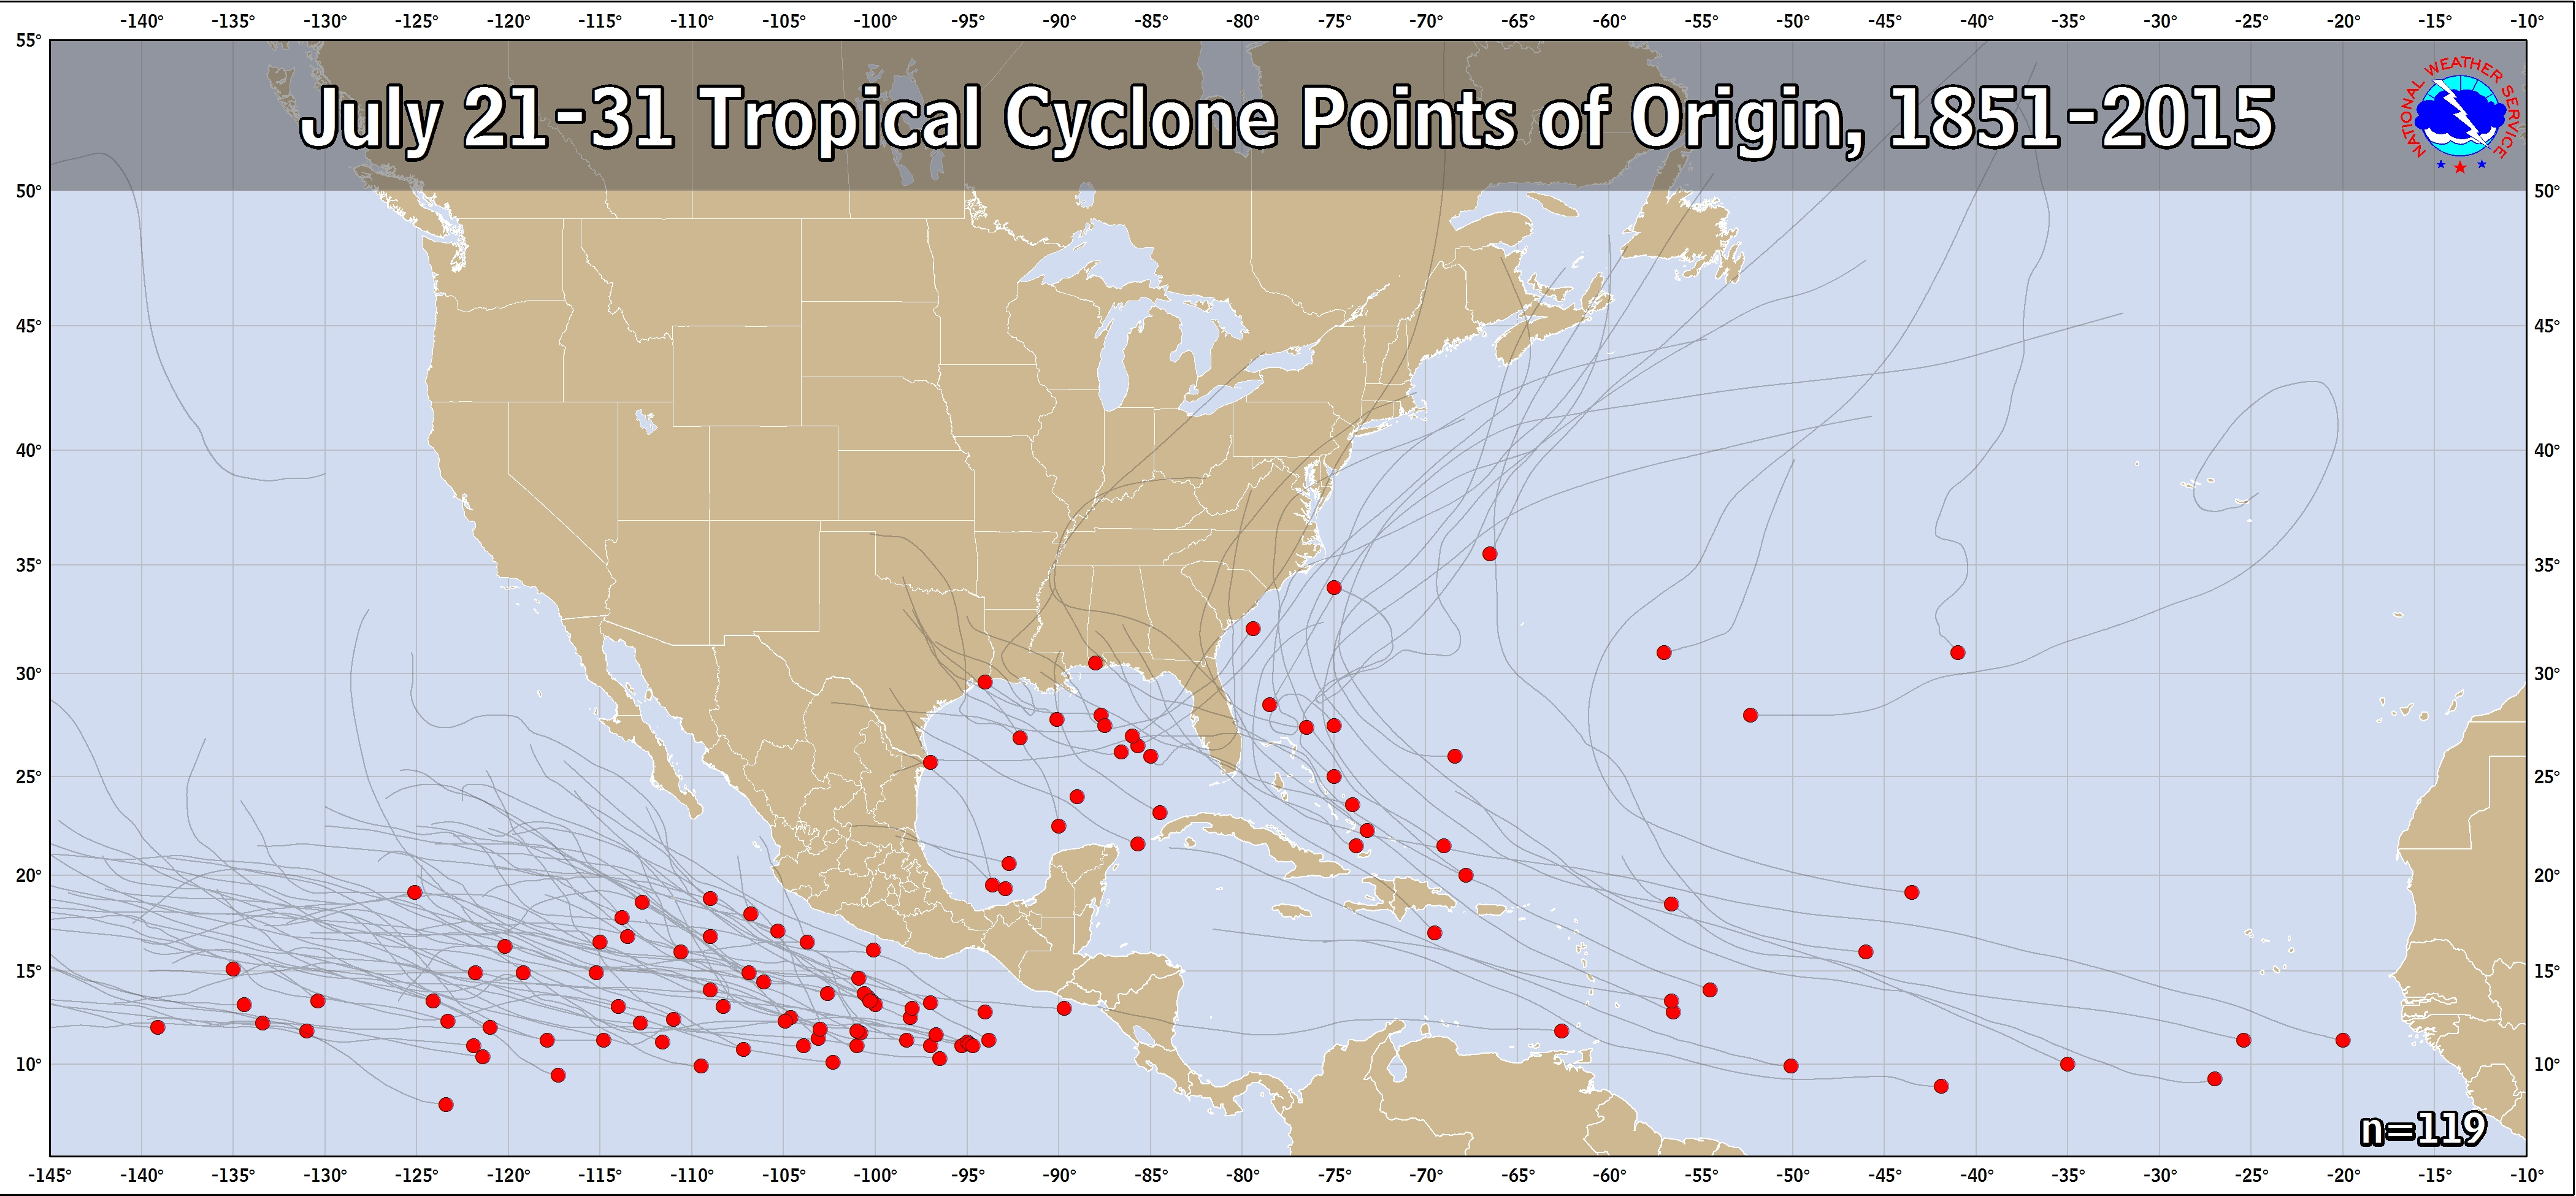
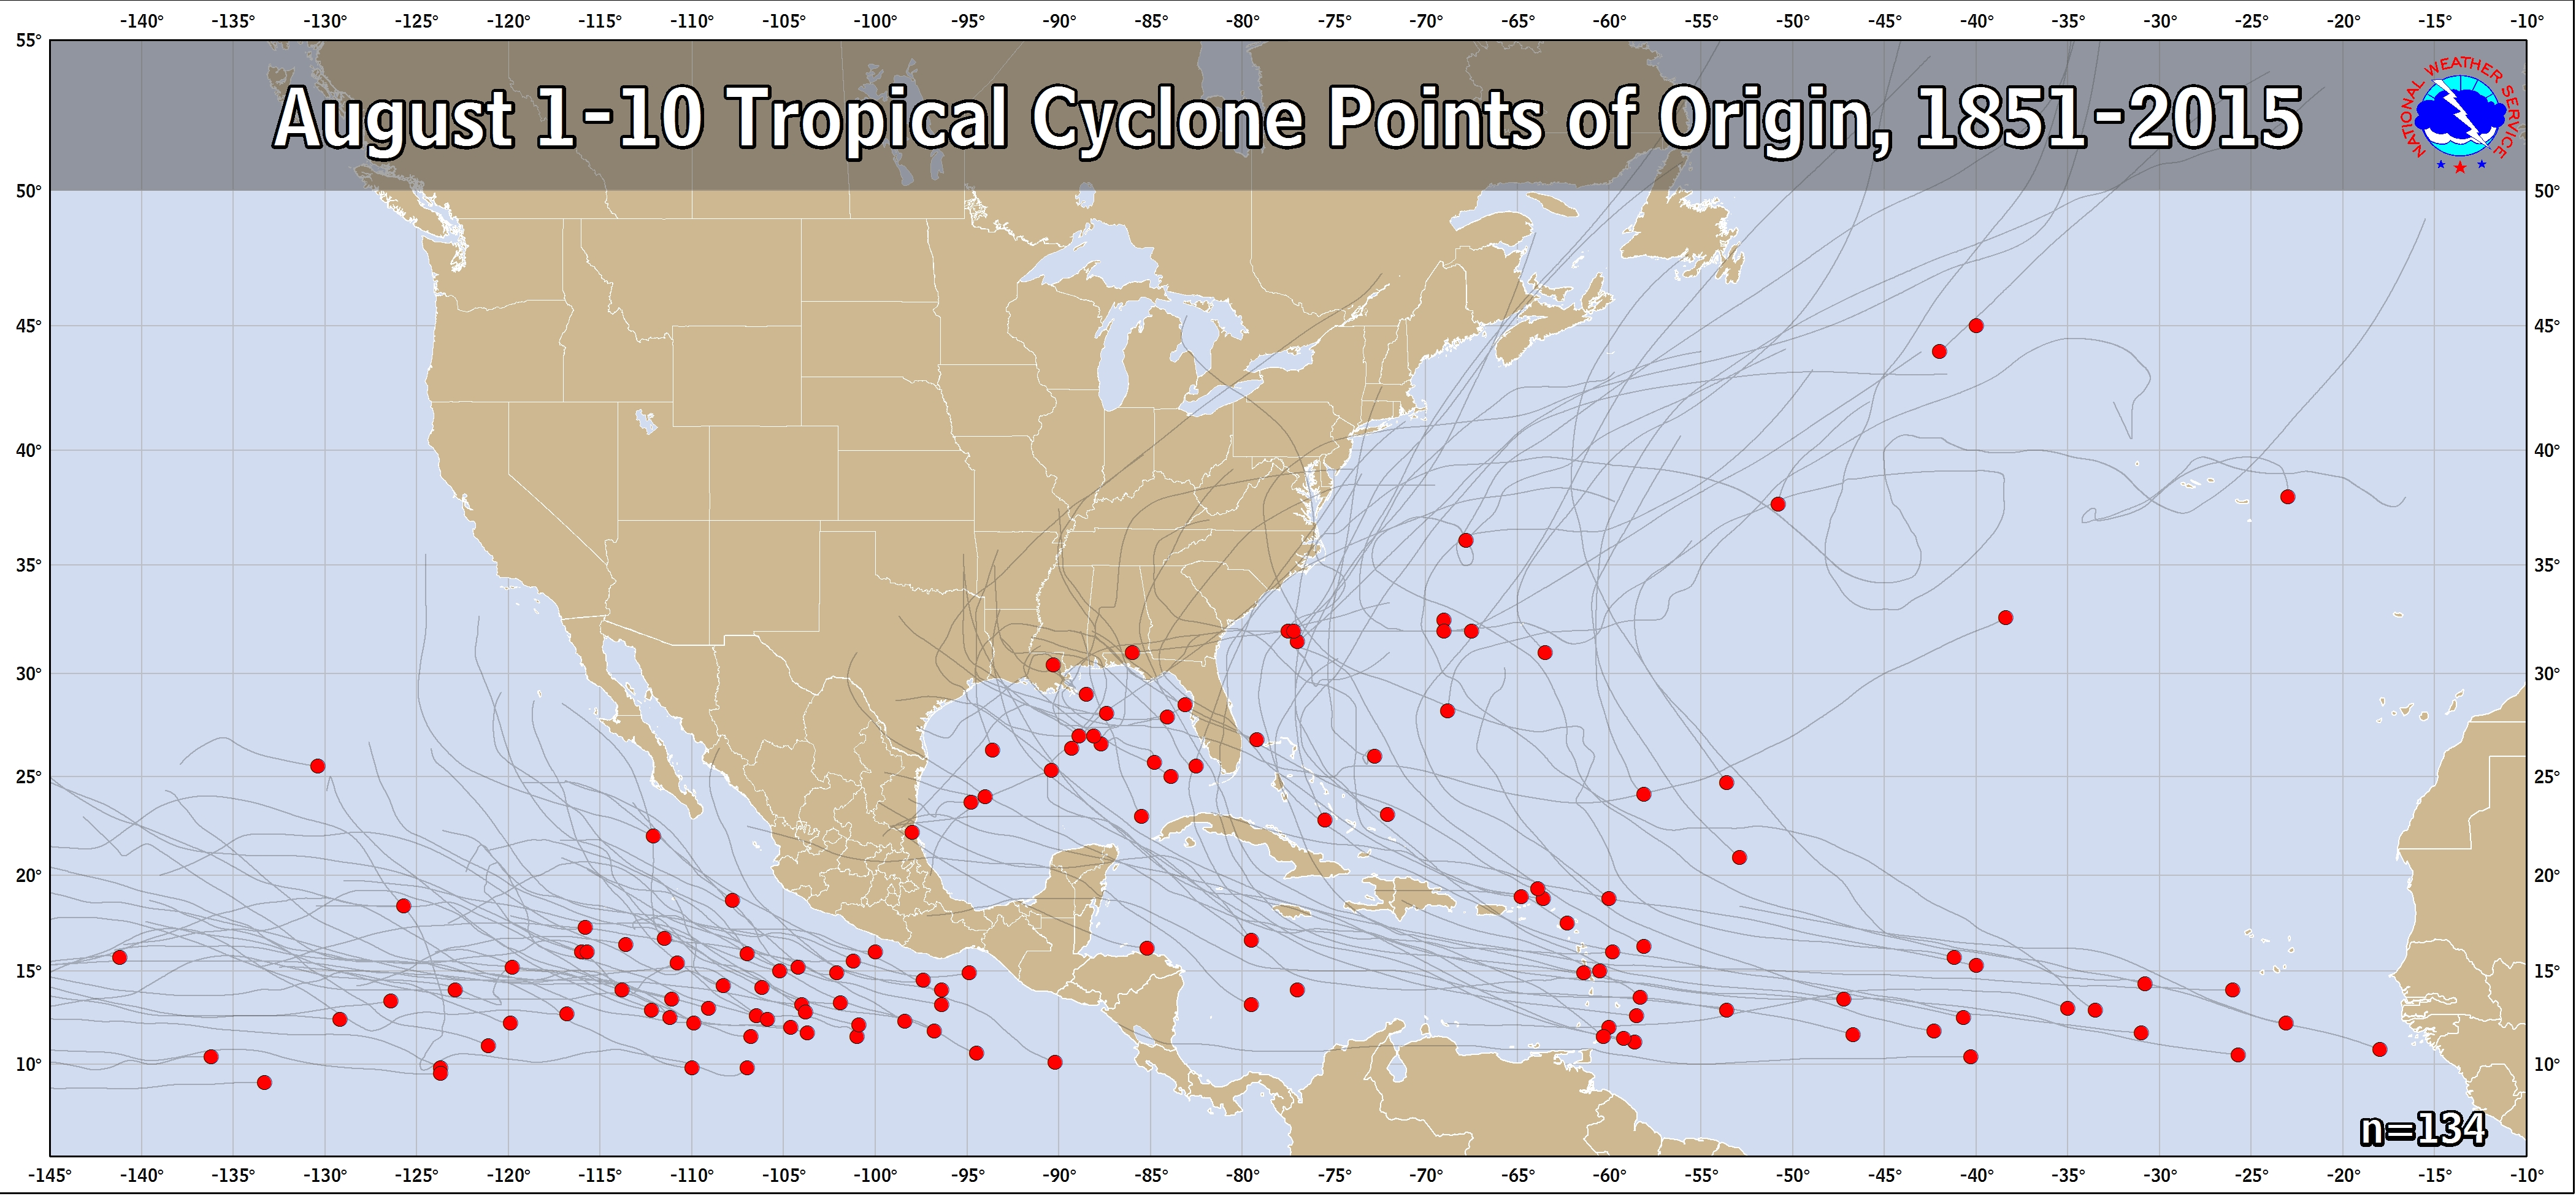
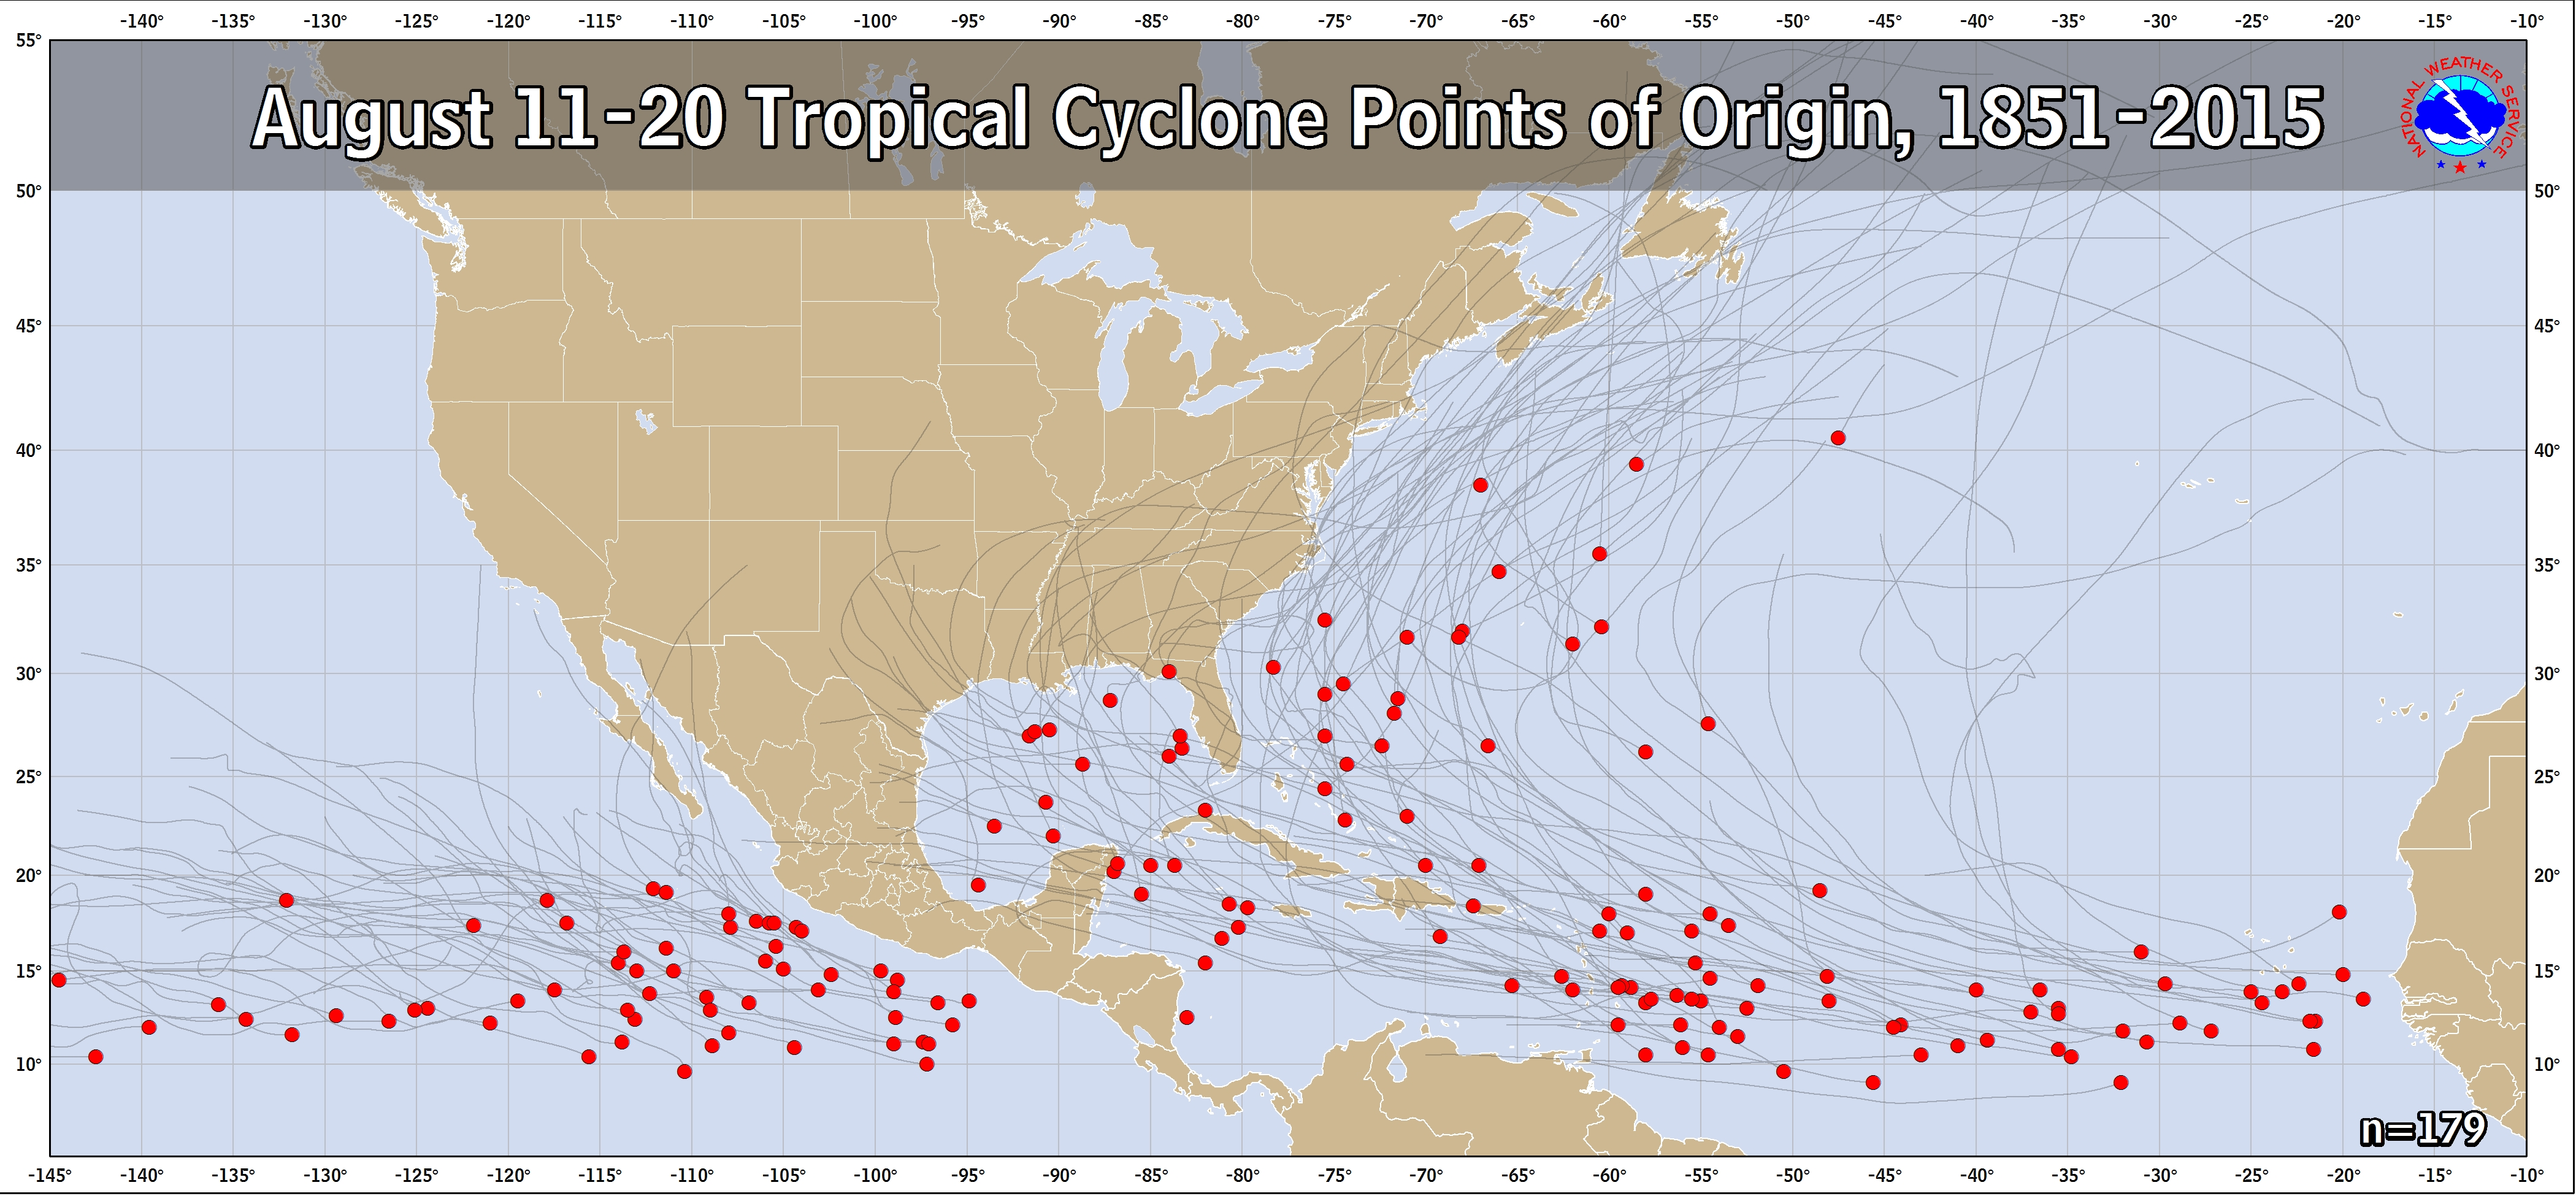
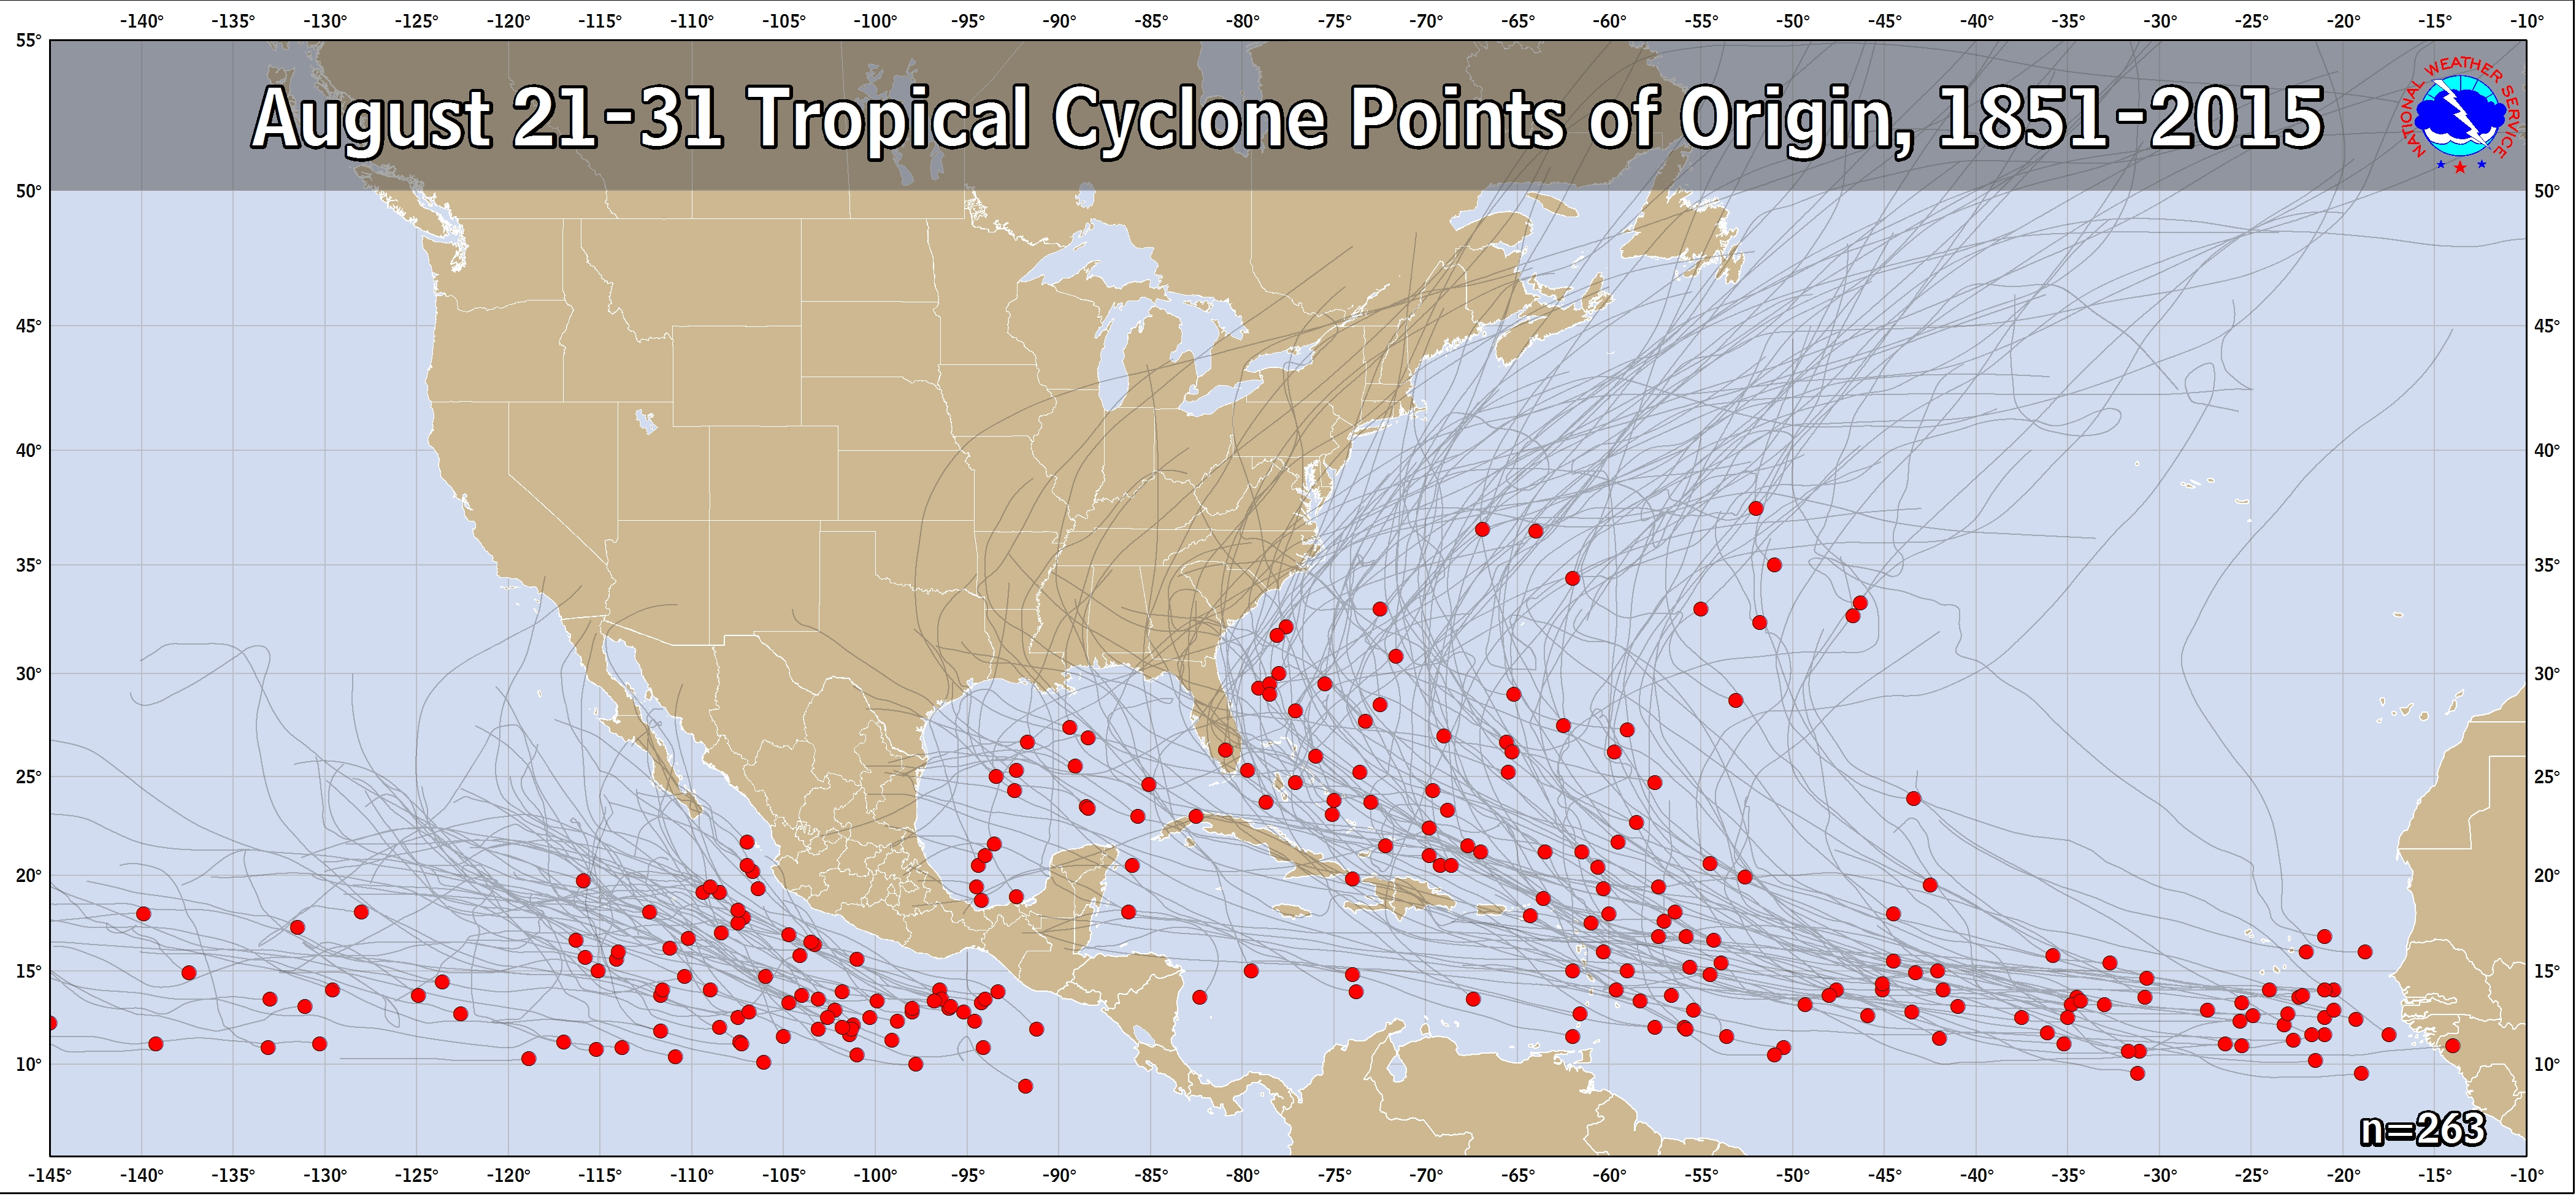
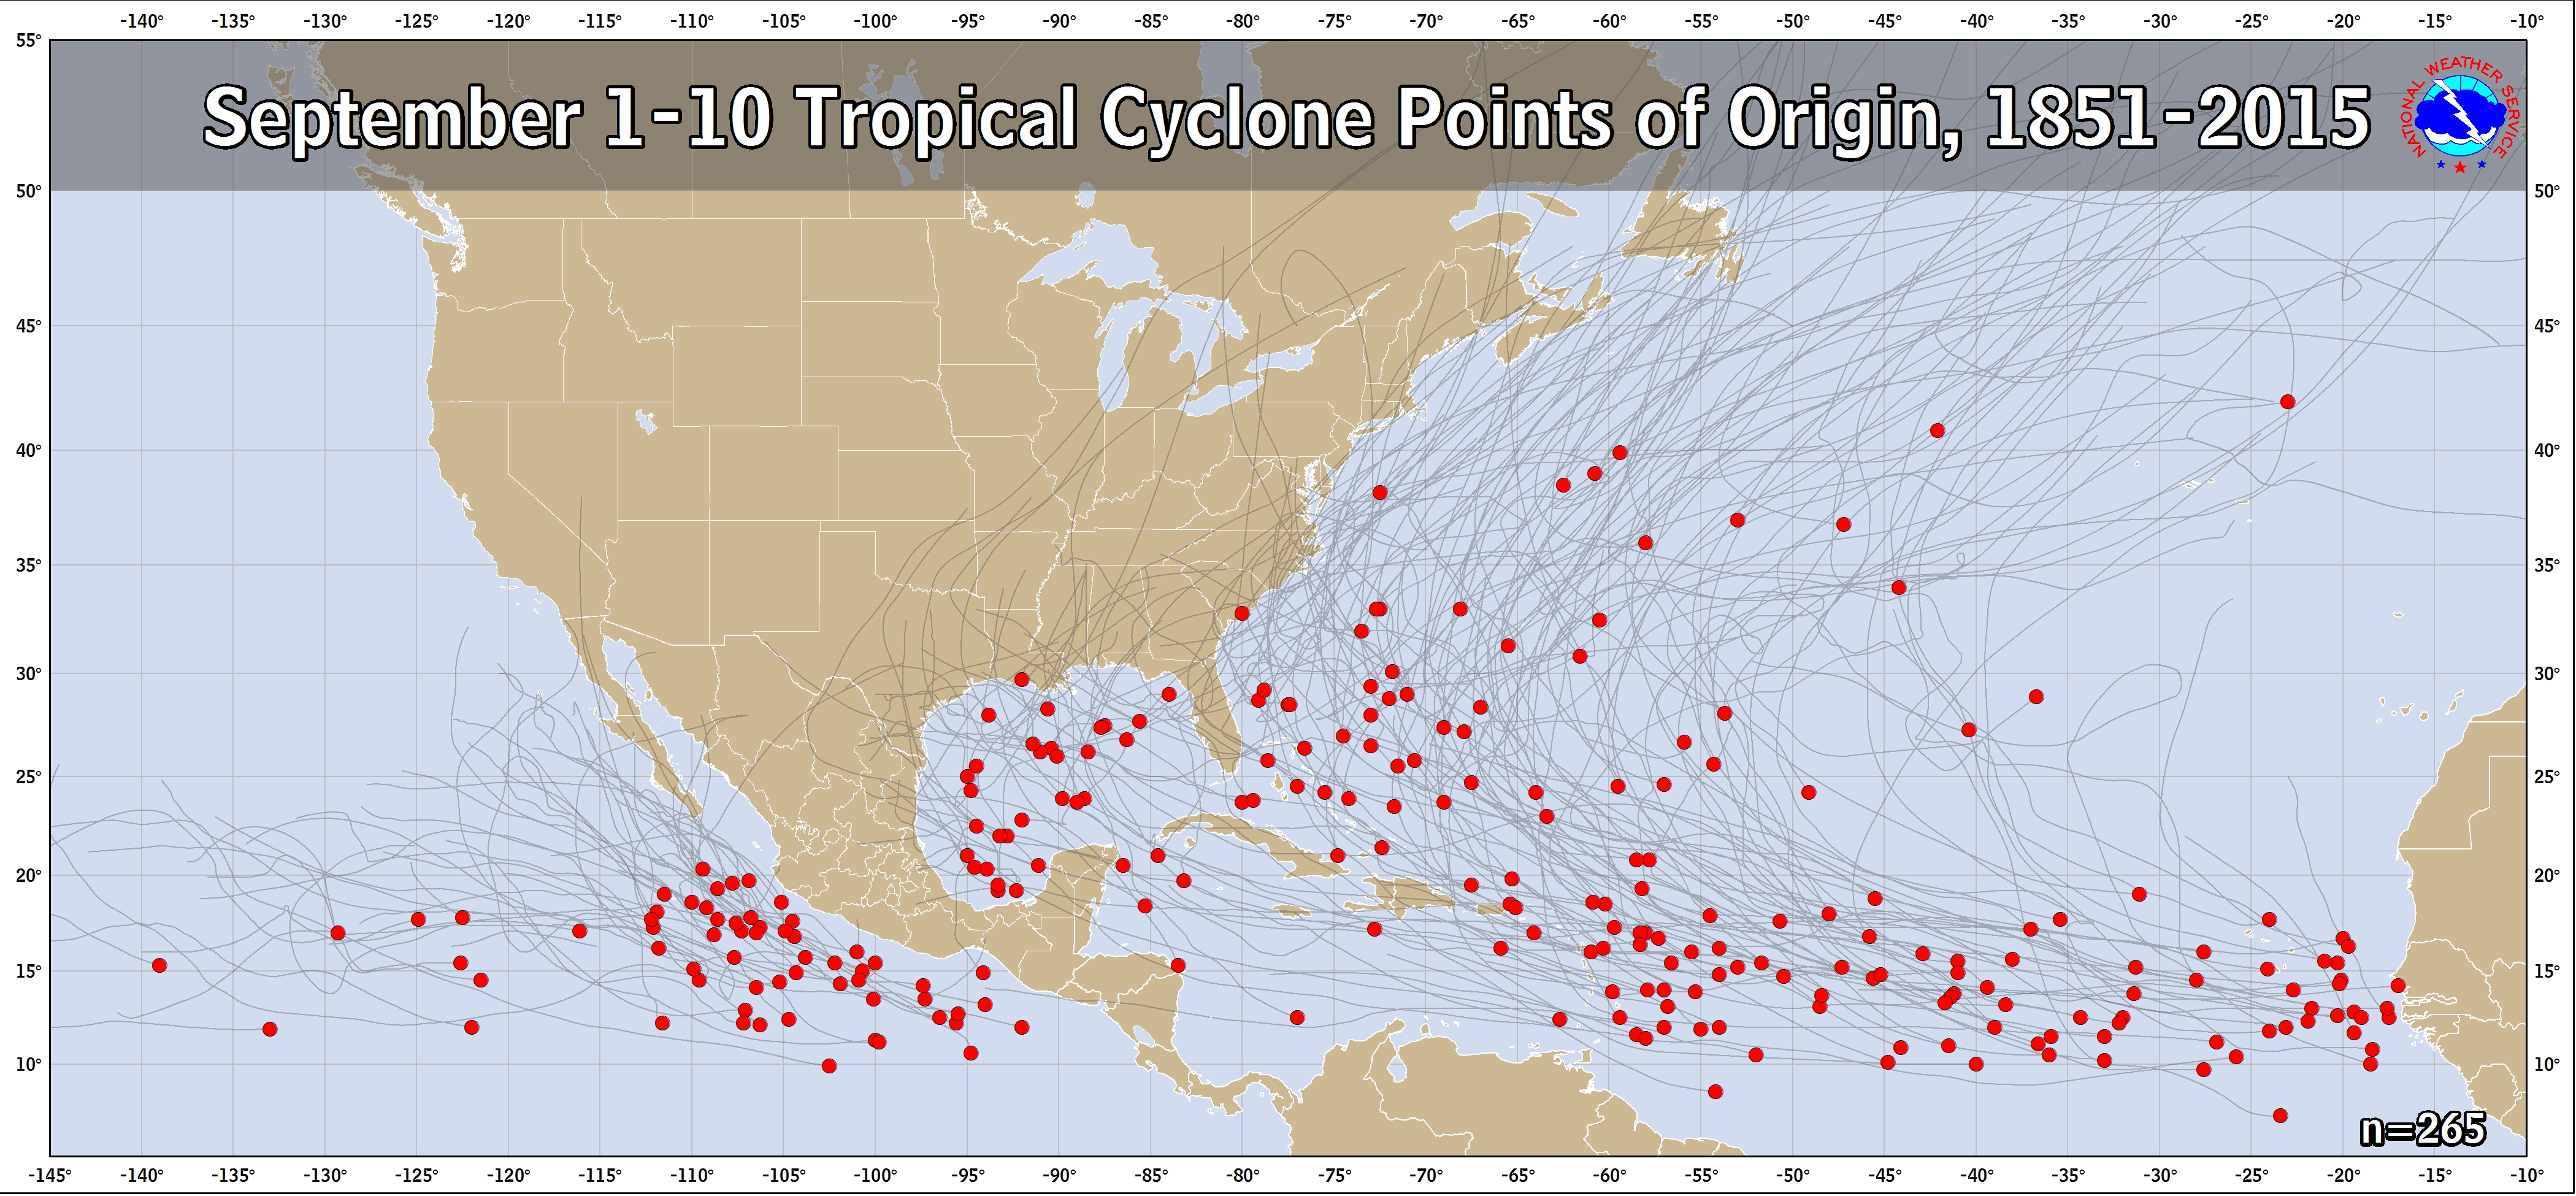
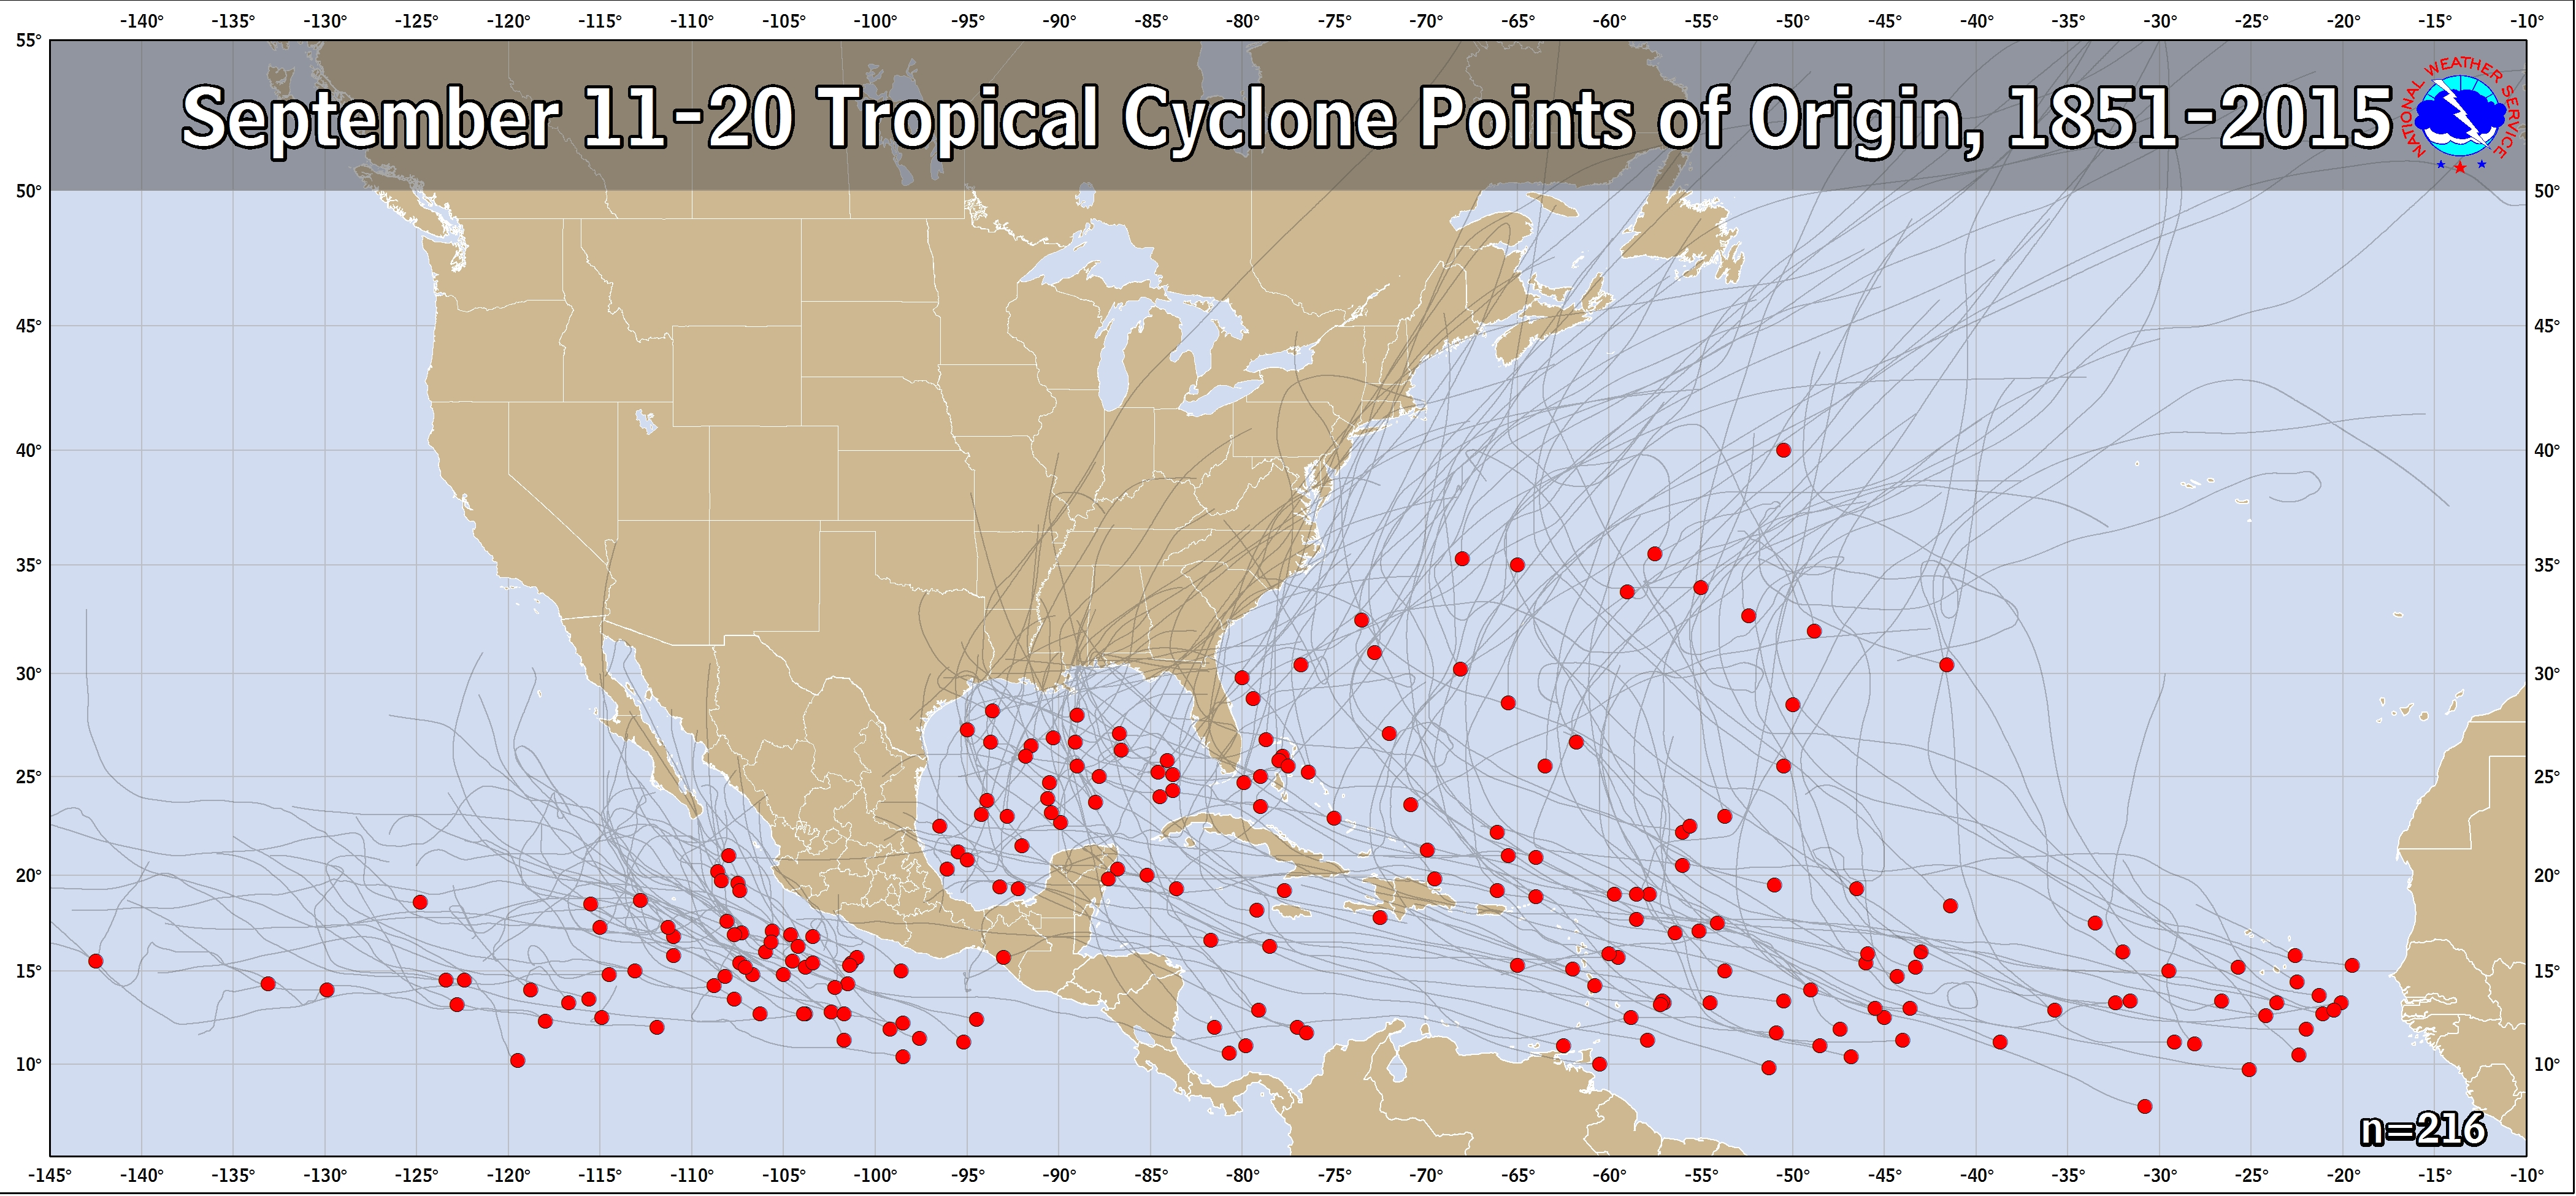
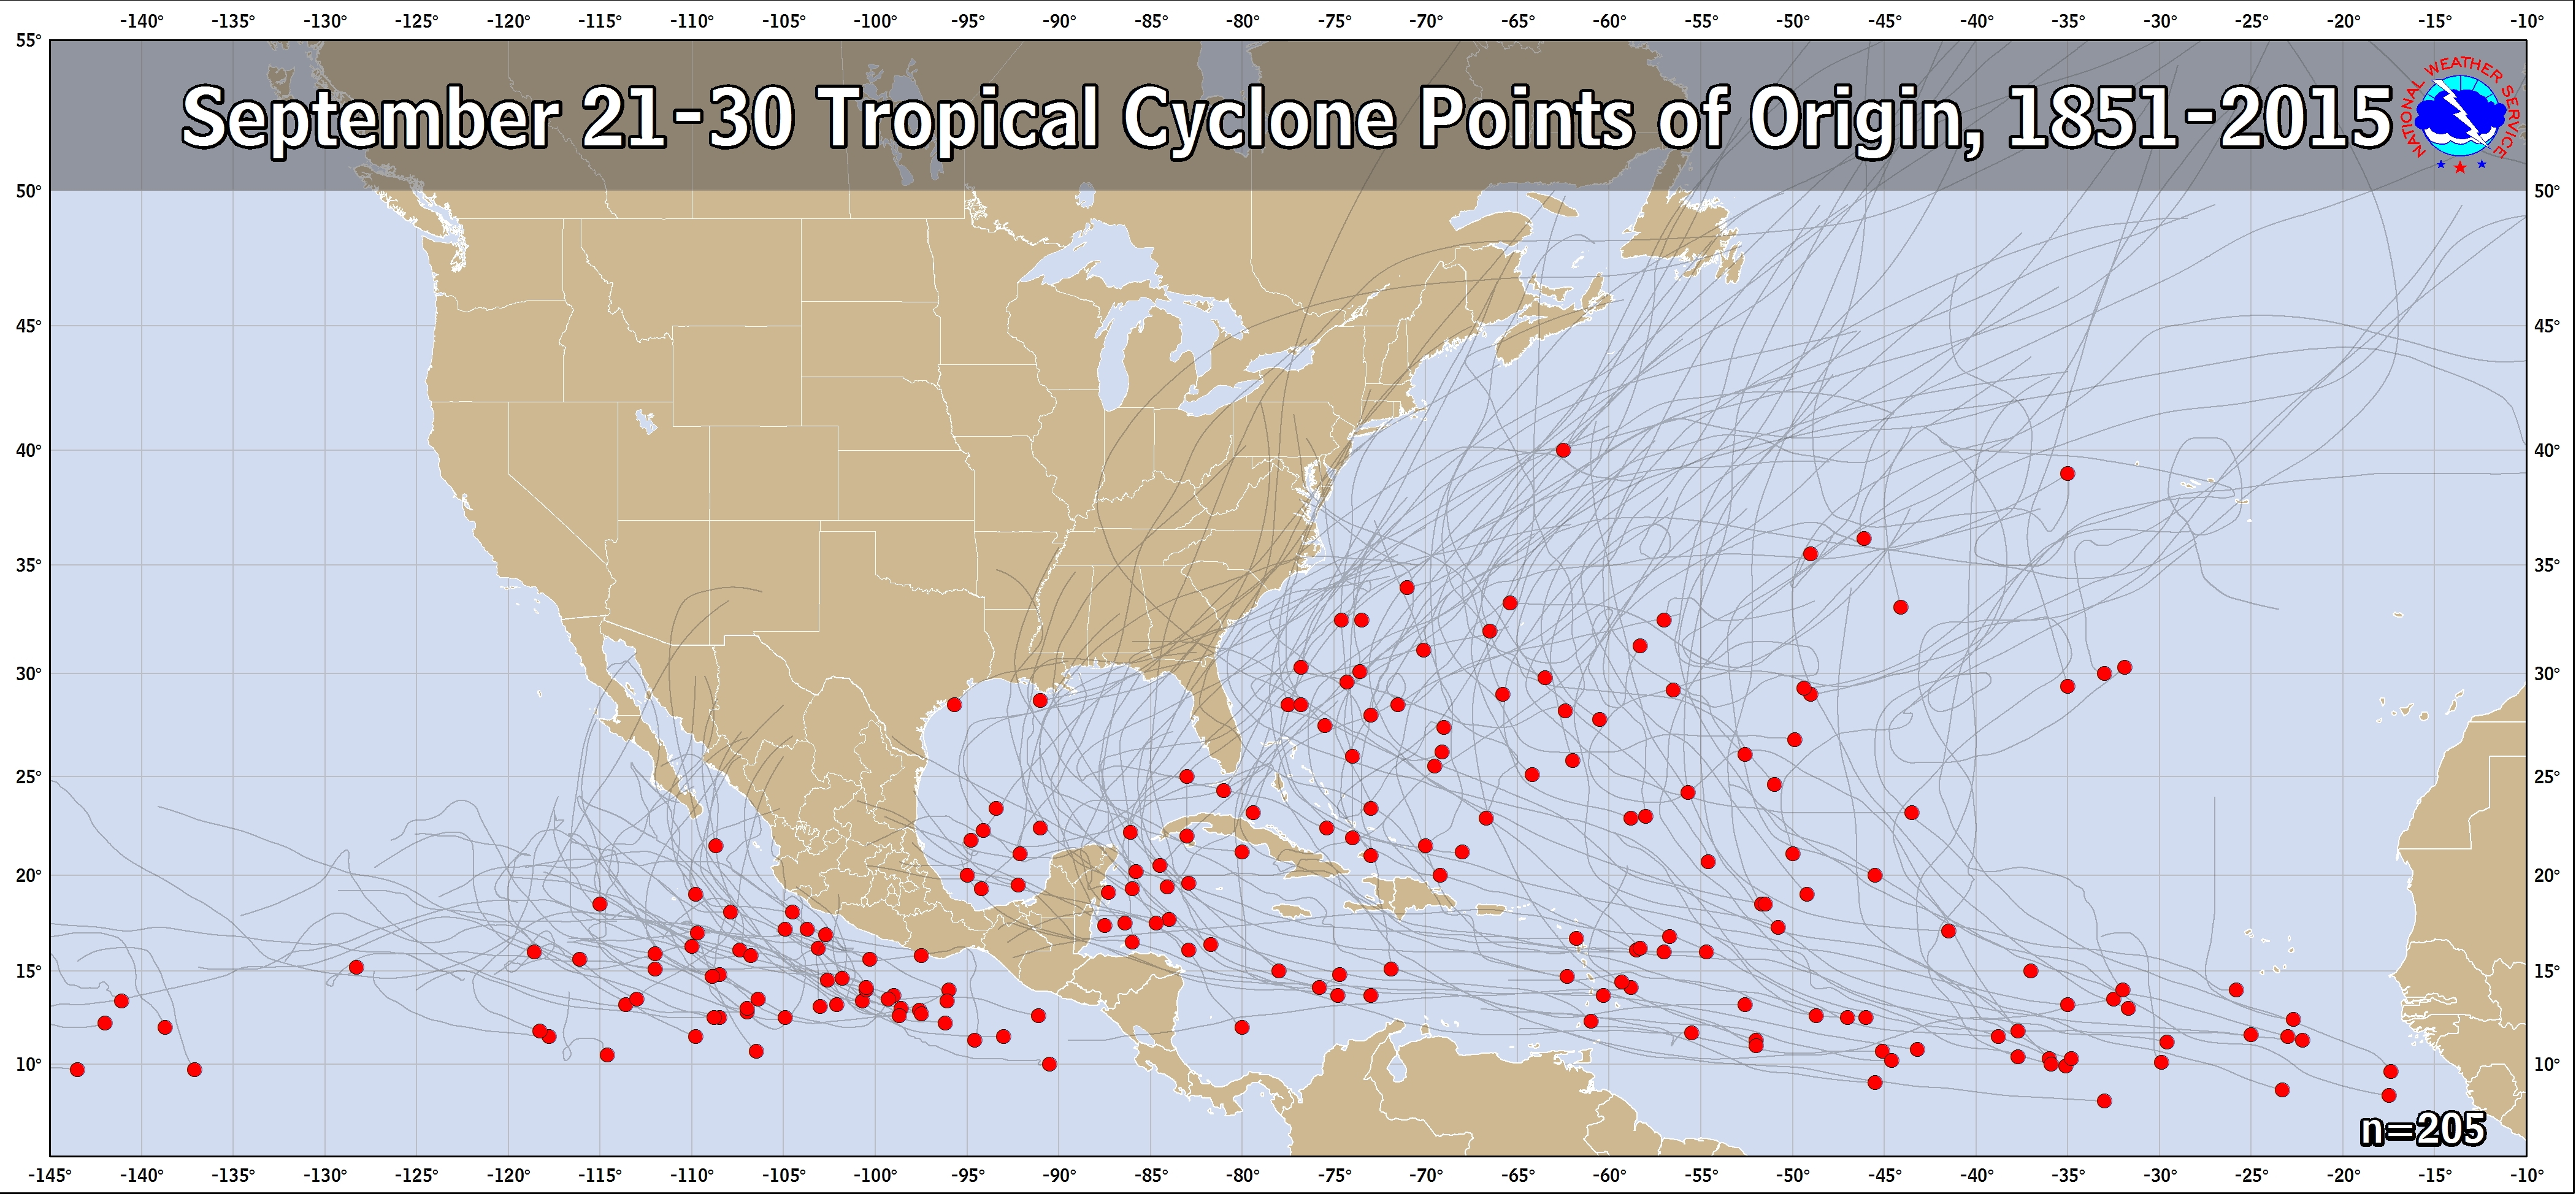
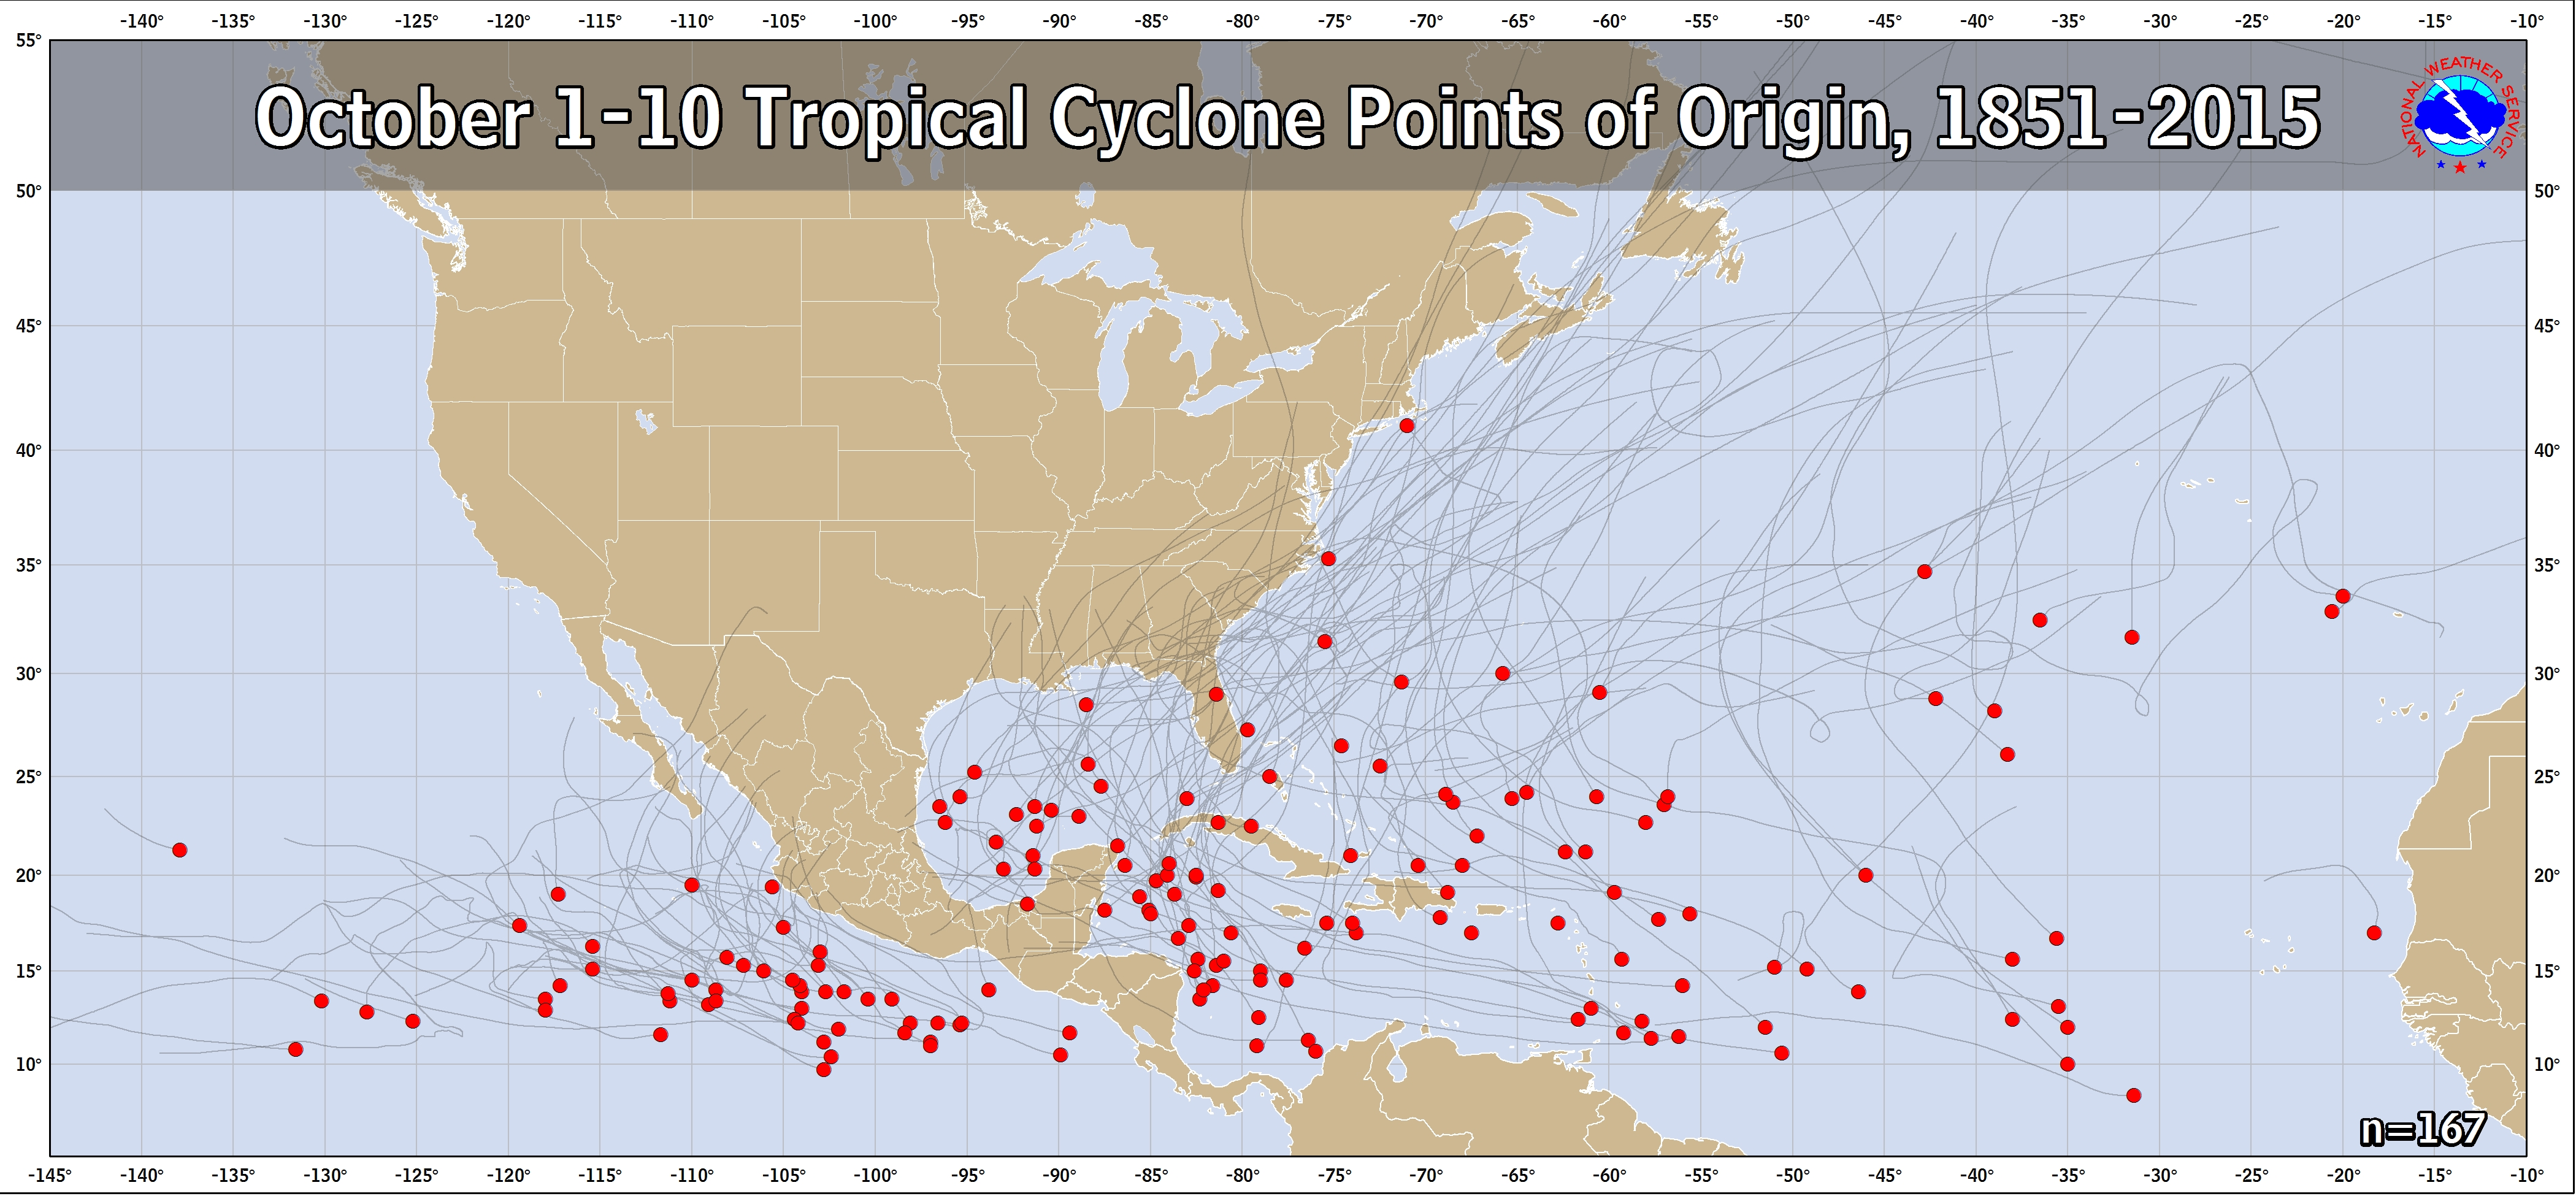
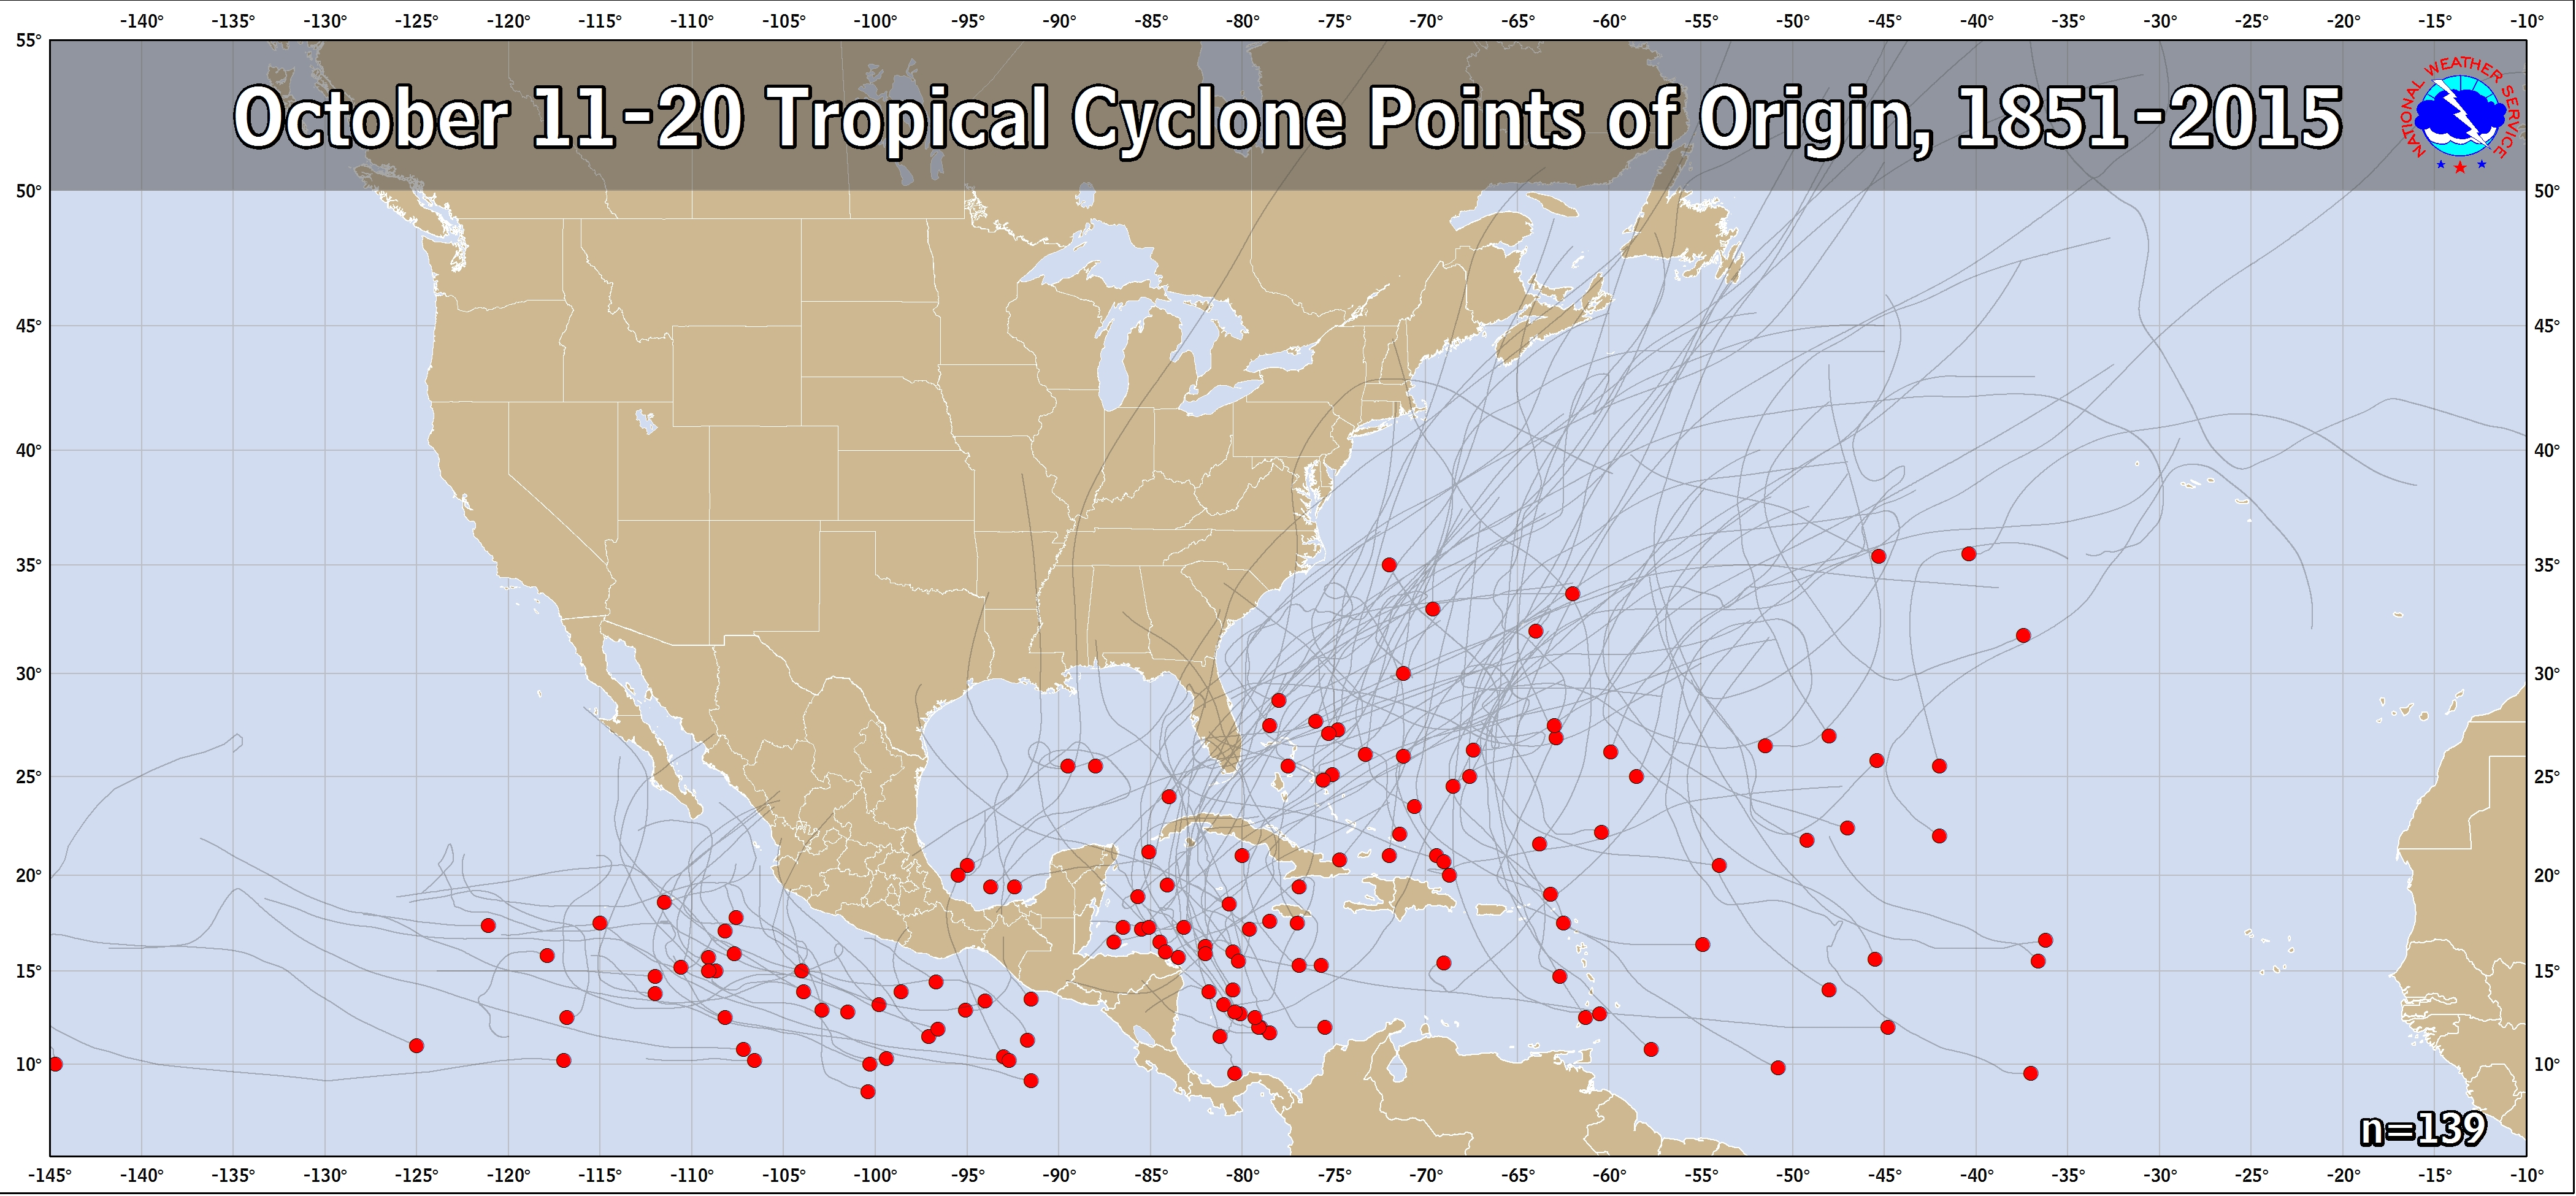
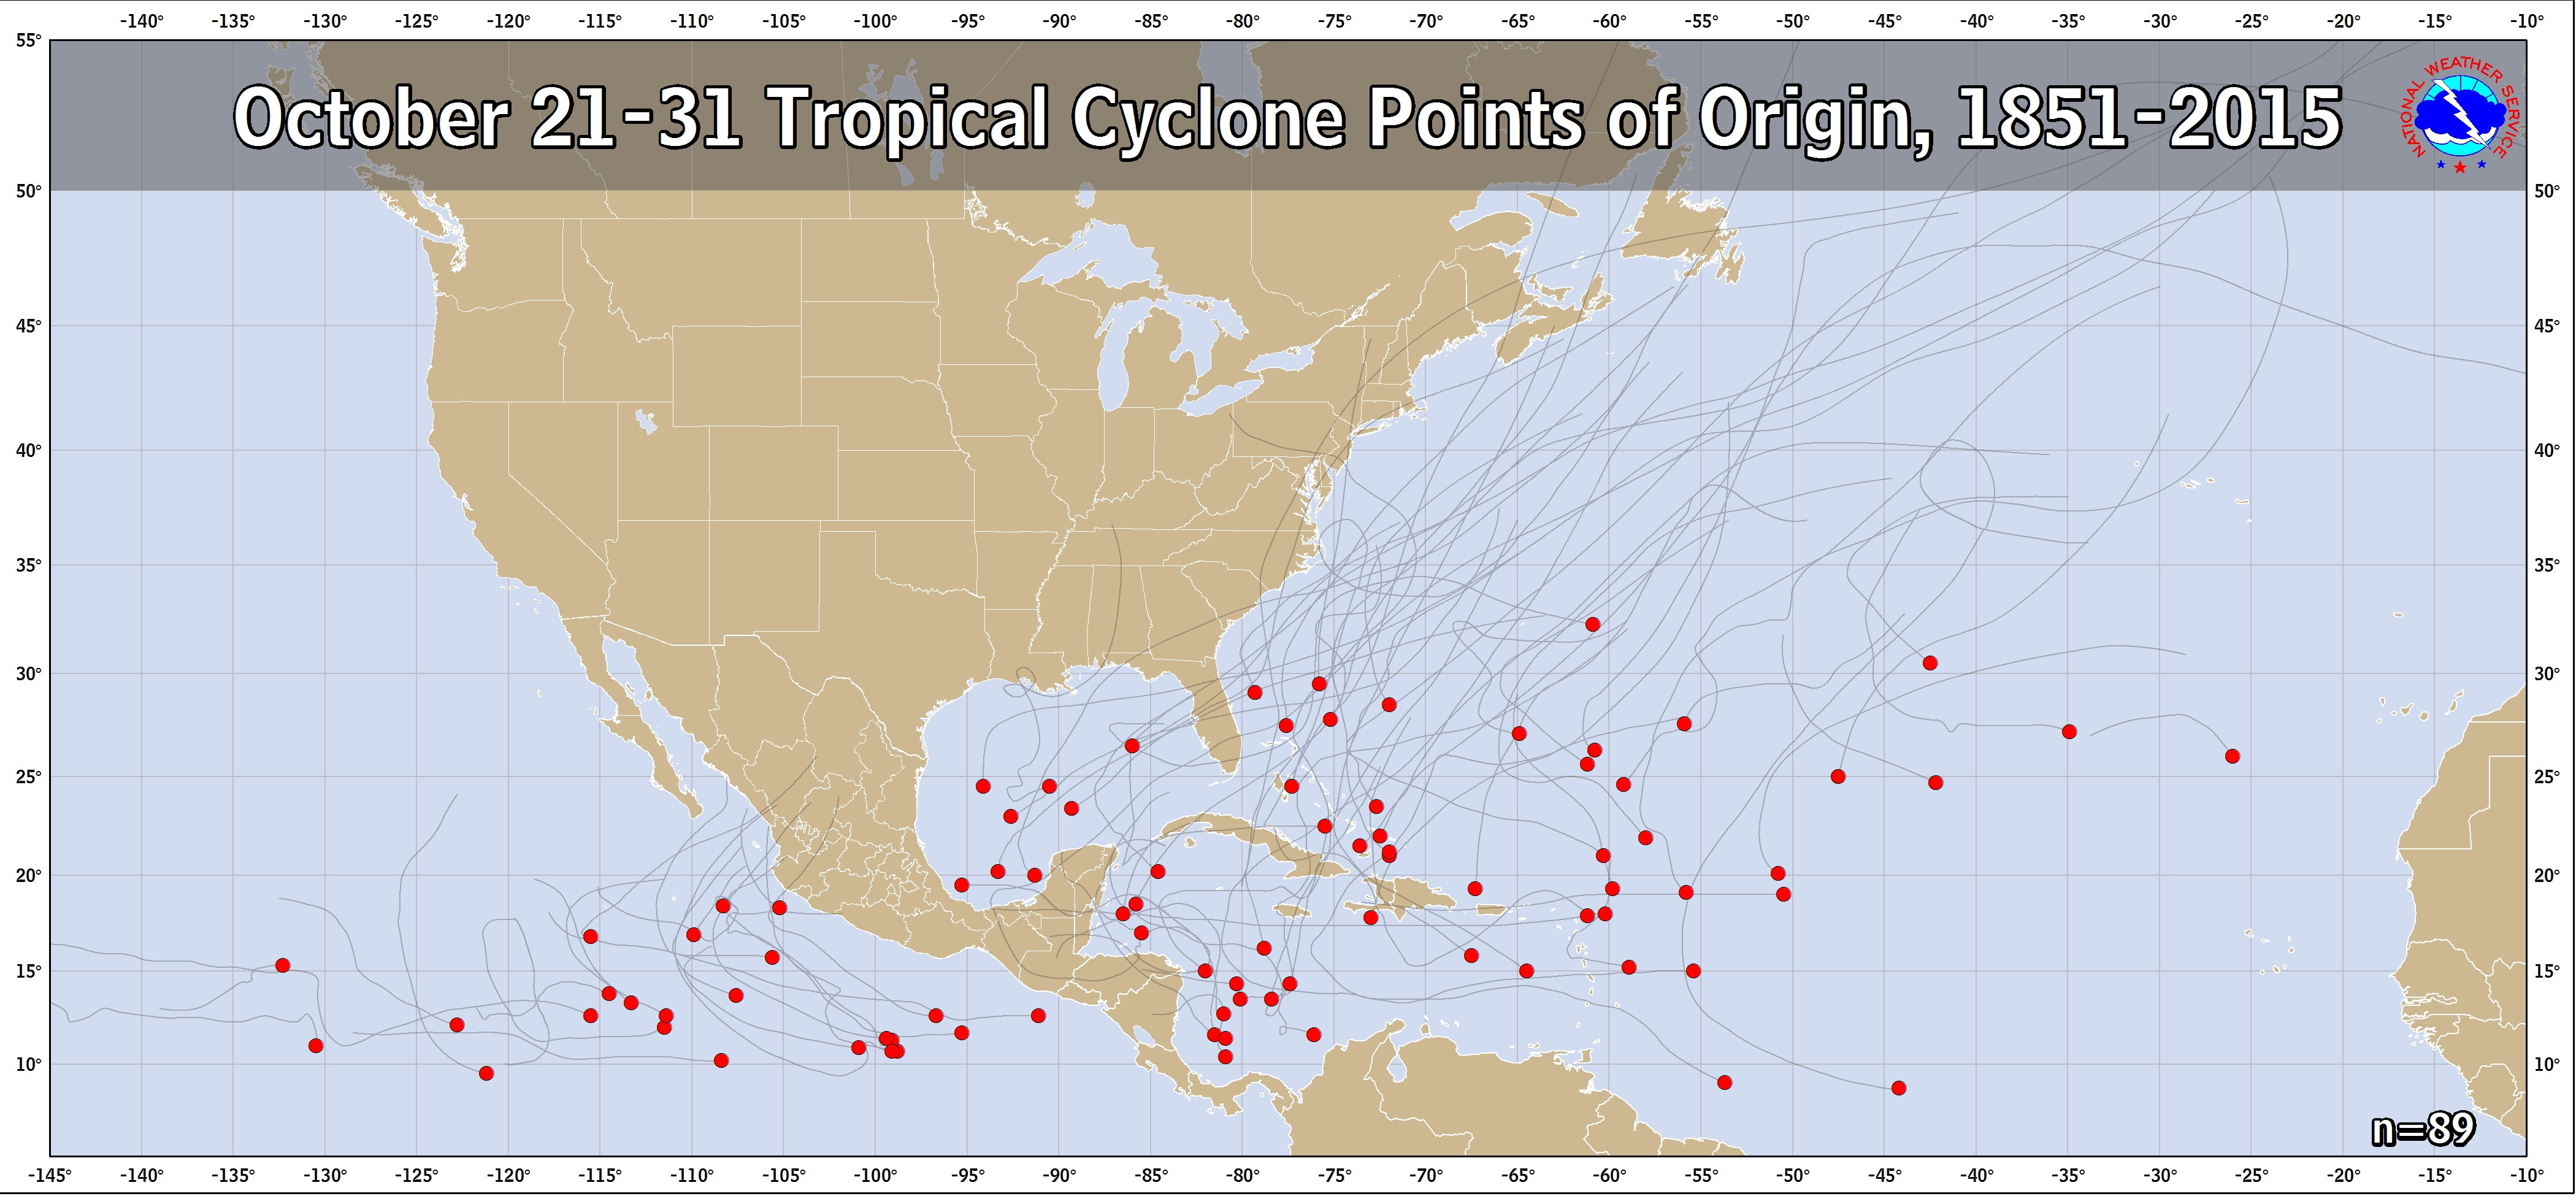
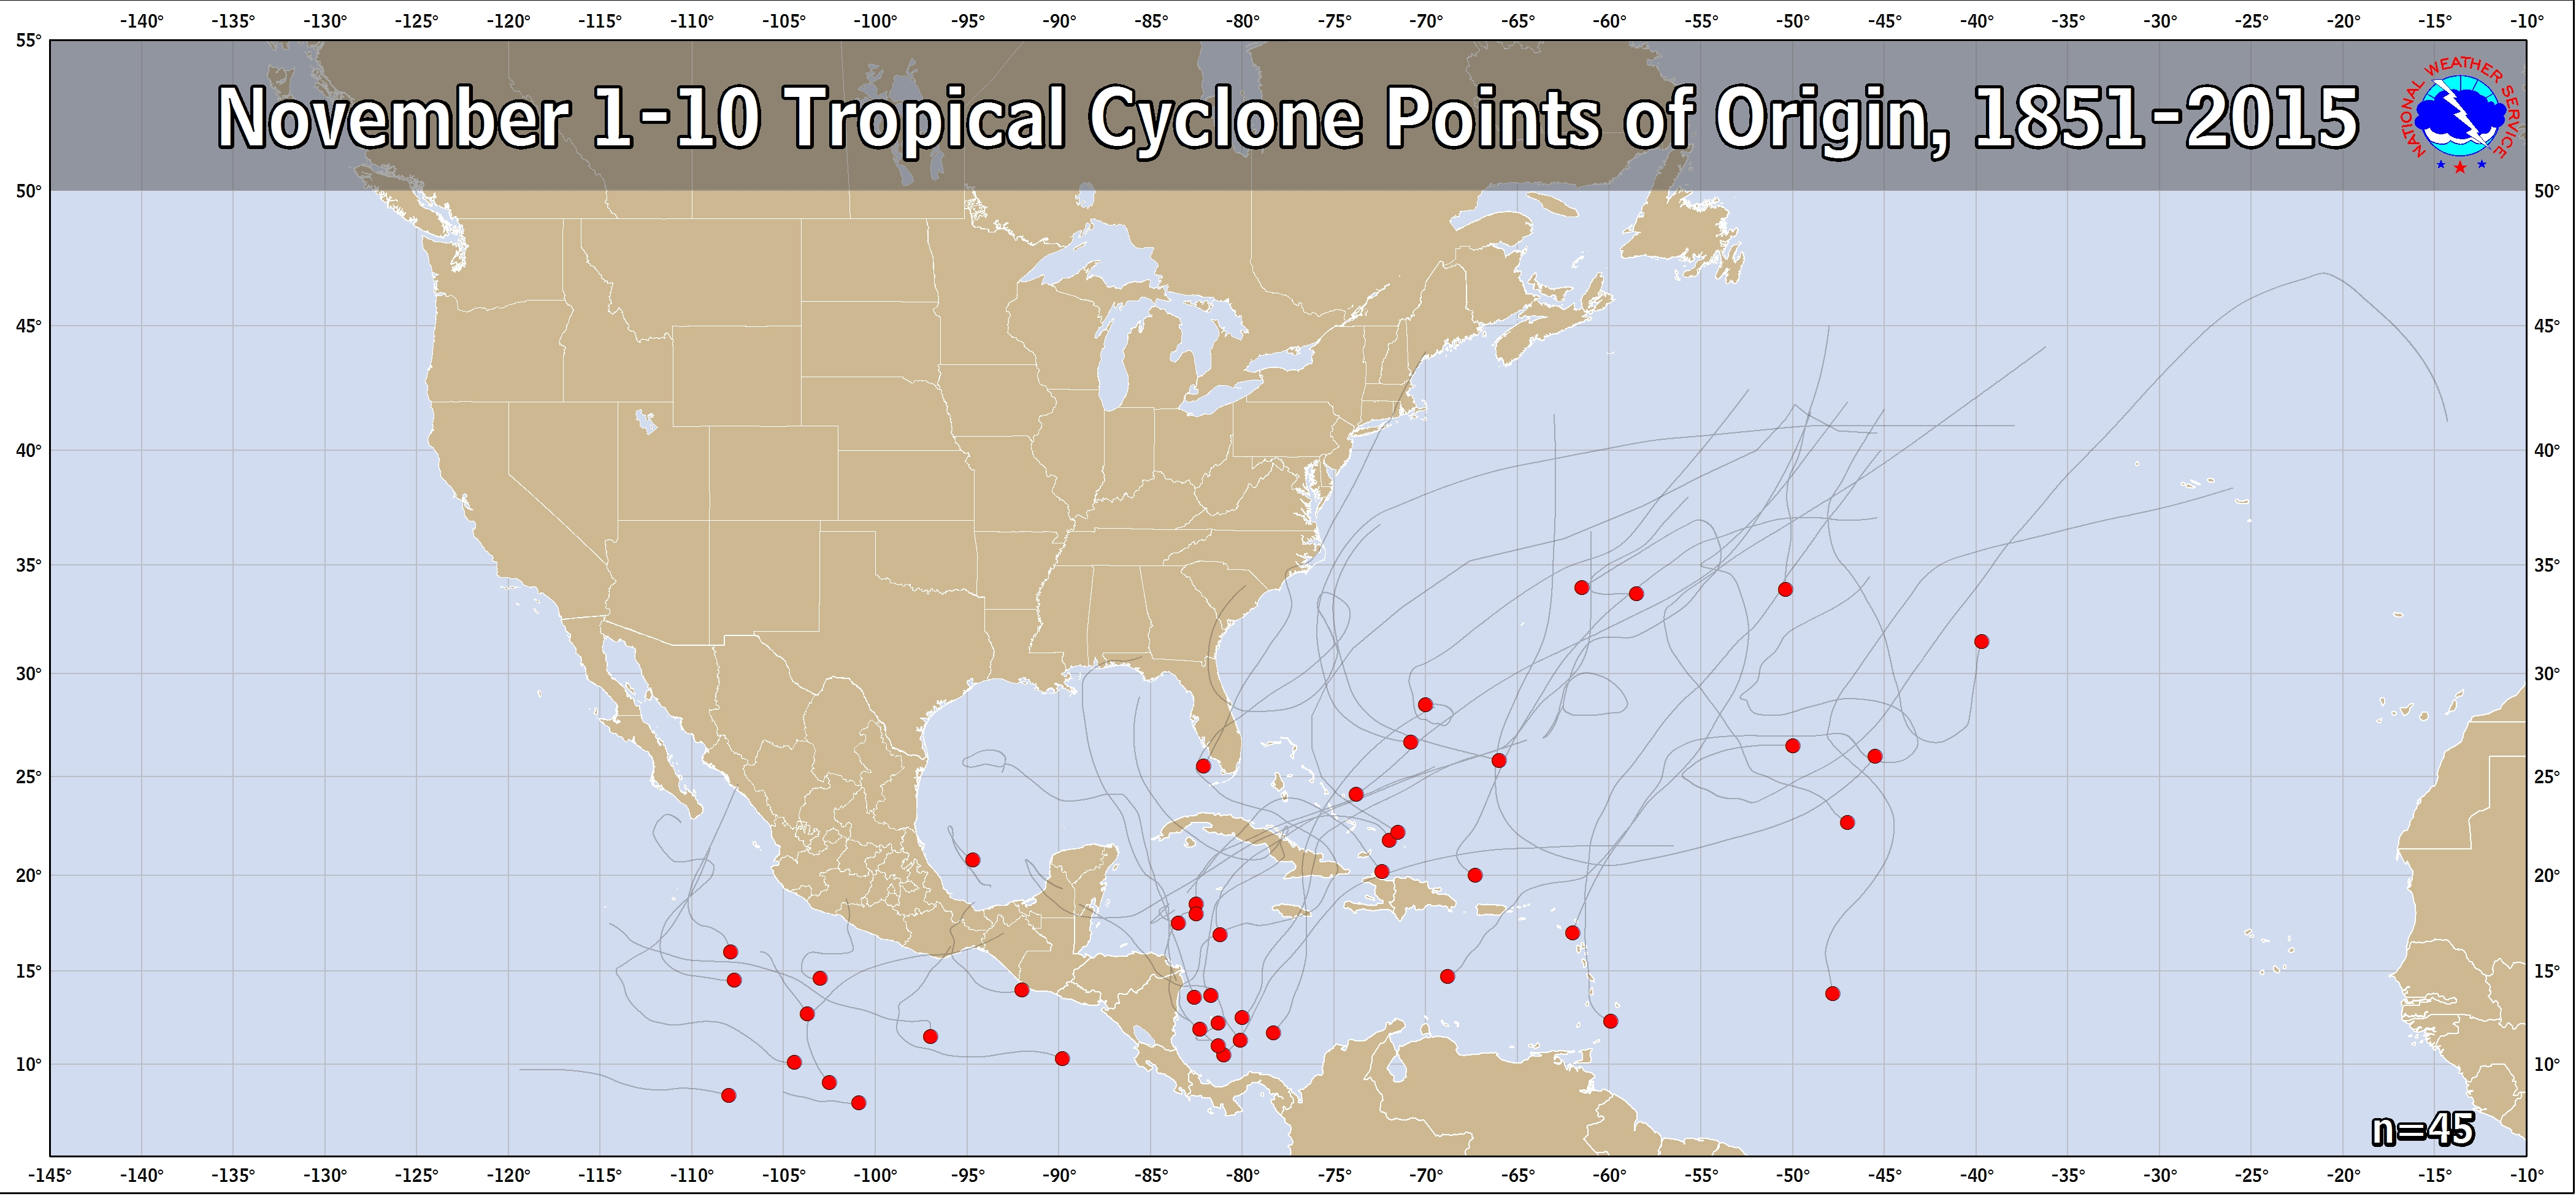
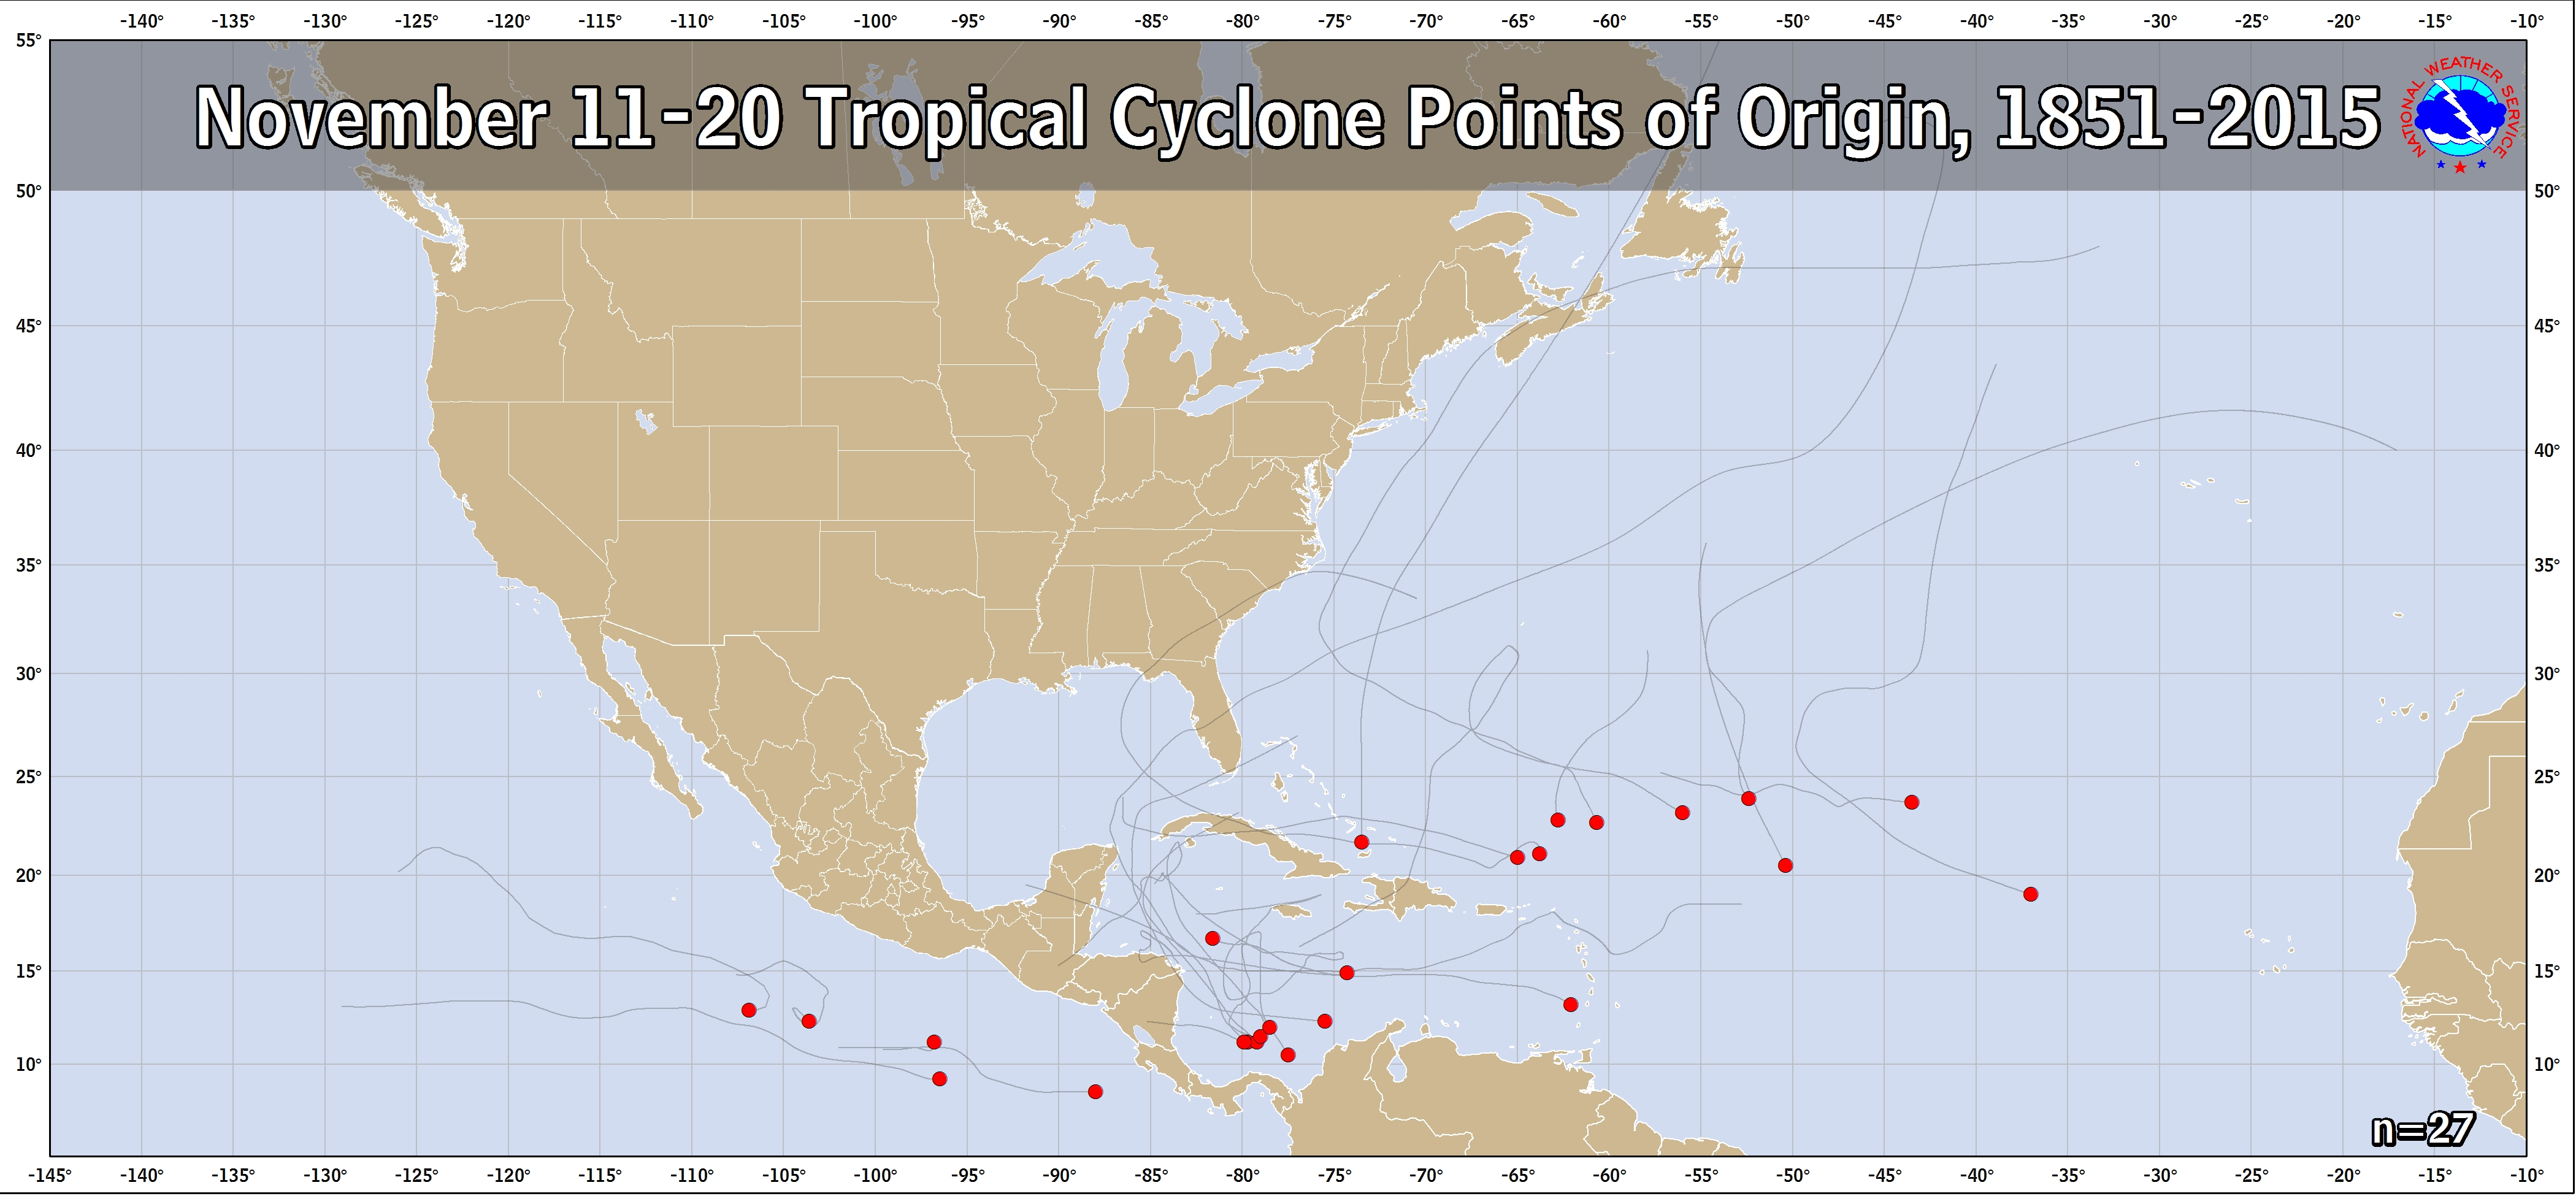
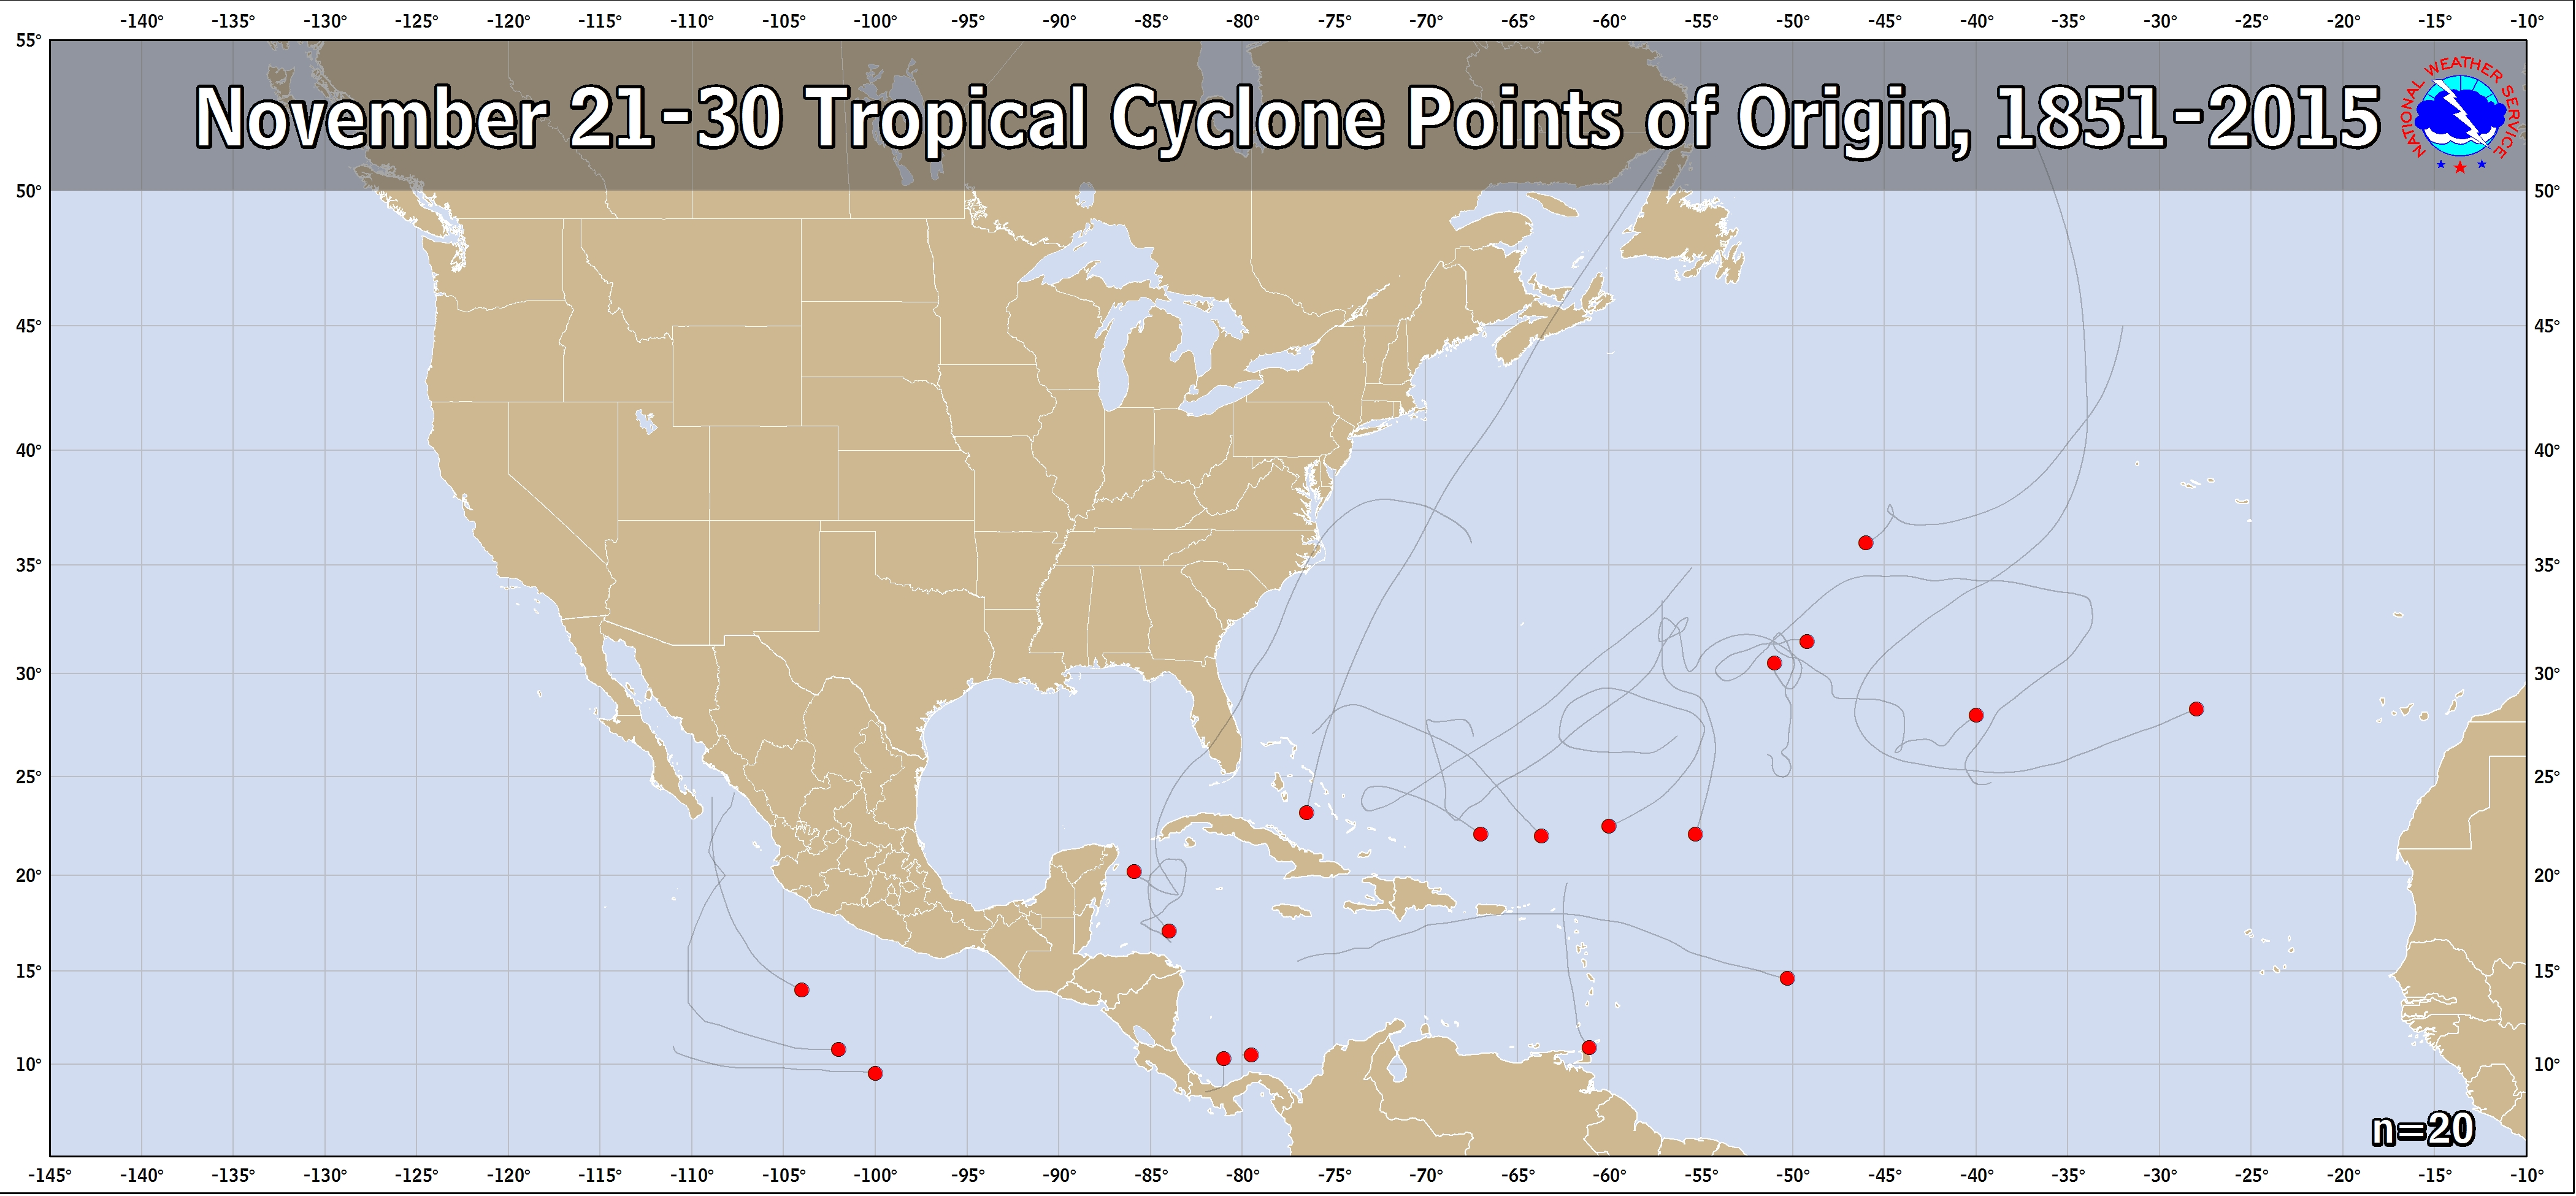
Points of Origin by 10-Day Period

The figures below show the points of tropical cyclone genesis by 10-day periods during the hurricane season. These figures depict named storms only; no subtropical storms or unnamed storms. The source years include 1851-2009 for the Atlantic and 1949-2009 for the Eastern Pacific from the HURDAT database.

Tropical Cyclone Genesis Climatology

Tropical Cyclone Genesis Climatology

Tropical Cyclone Genesis Climatology

Tropical Cyclone Genesis Climatology

Tropical Cyclone Genesis Climatology

Tropical Cyclone Genesis Climatology

Tropical Cyclone Genesis Climatology

Tropical Cyclone Genesis Climatology

Tropical Cyclone Genesis Climatology

Tropical Cyclone Genesis Climatology

Tropical Cyclone Genesis Climatology

Tropical Cyclone Genesis Climatology

Tropical Cyclone Genesis Climatology

Tropical Cyclone Genesis Climatology

Tropical Cyclone Genesis Climatology

Tropical Cyclone Genesis Climatology

Tropical Cyclone Genesis Climatology

Tropical Cyclone Genesis Climatology

Tropical Cyclone Genesis Climatology

Tropical Cyclone Genesis Climatology

Tropical Cyclone Genesis Climatology

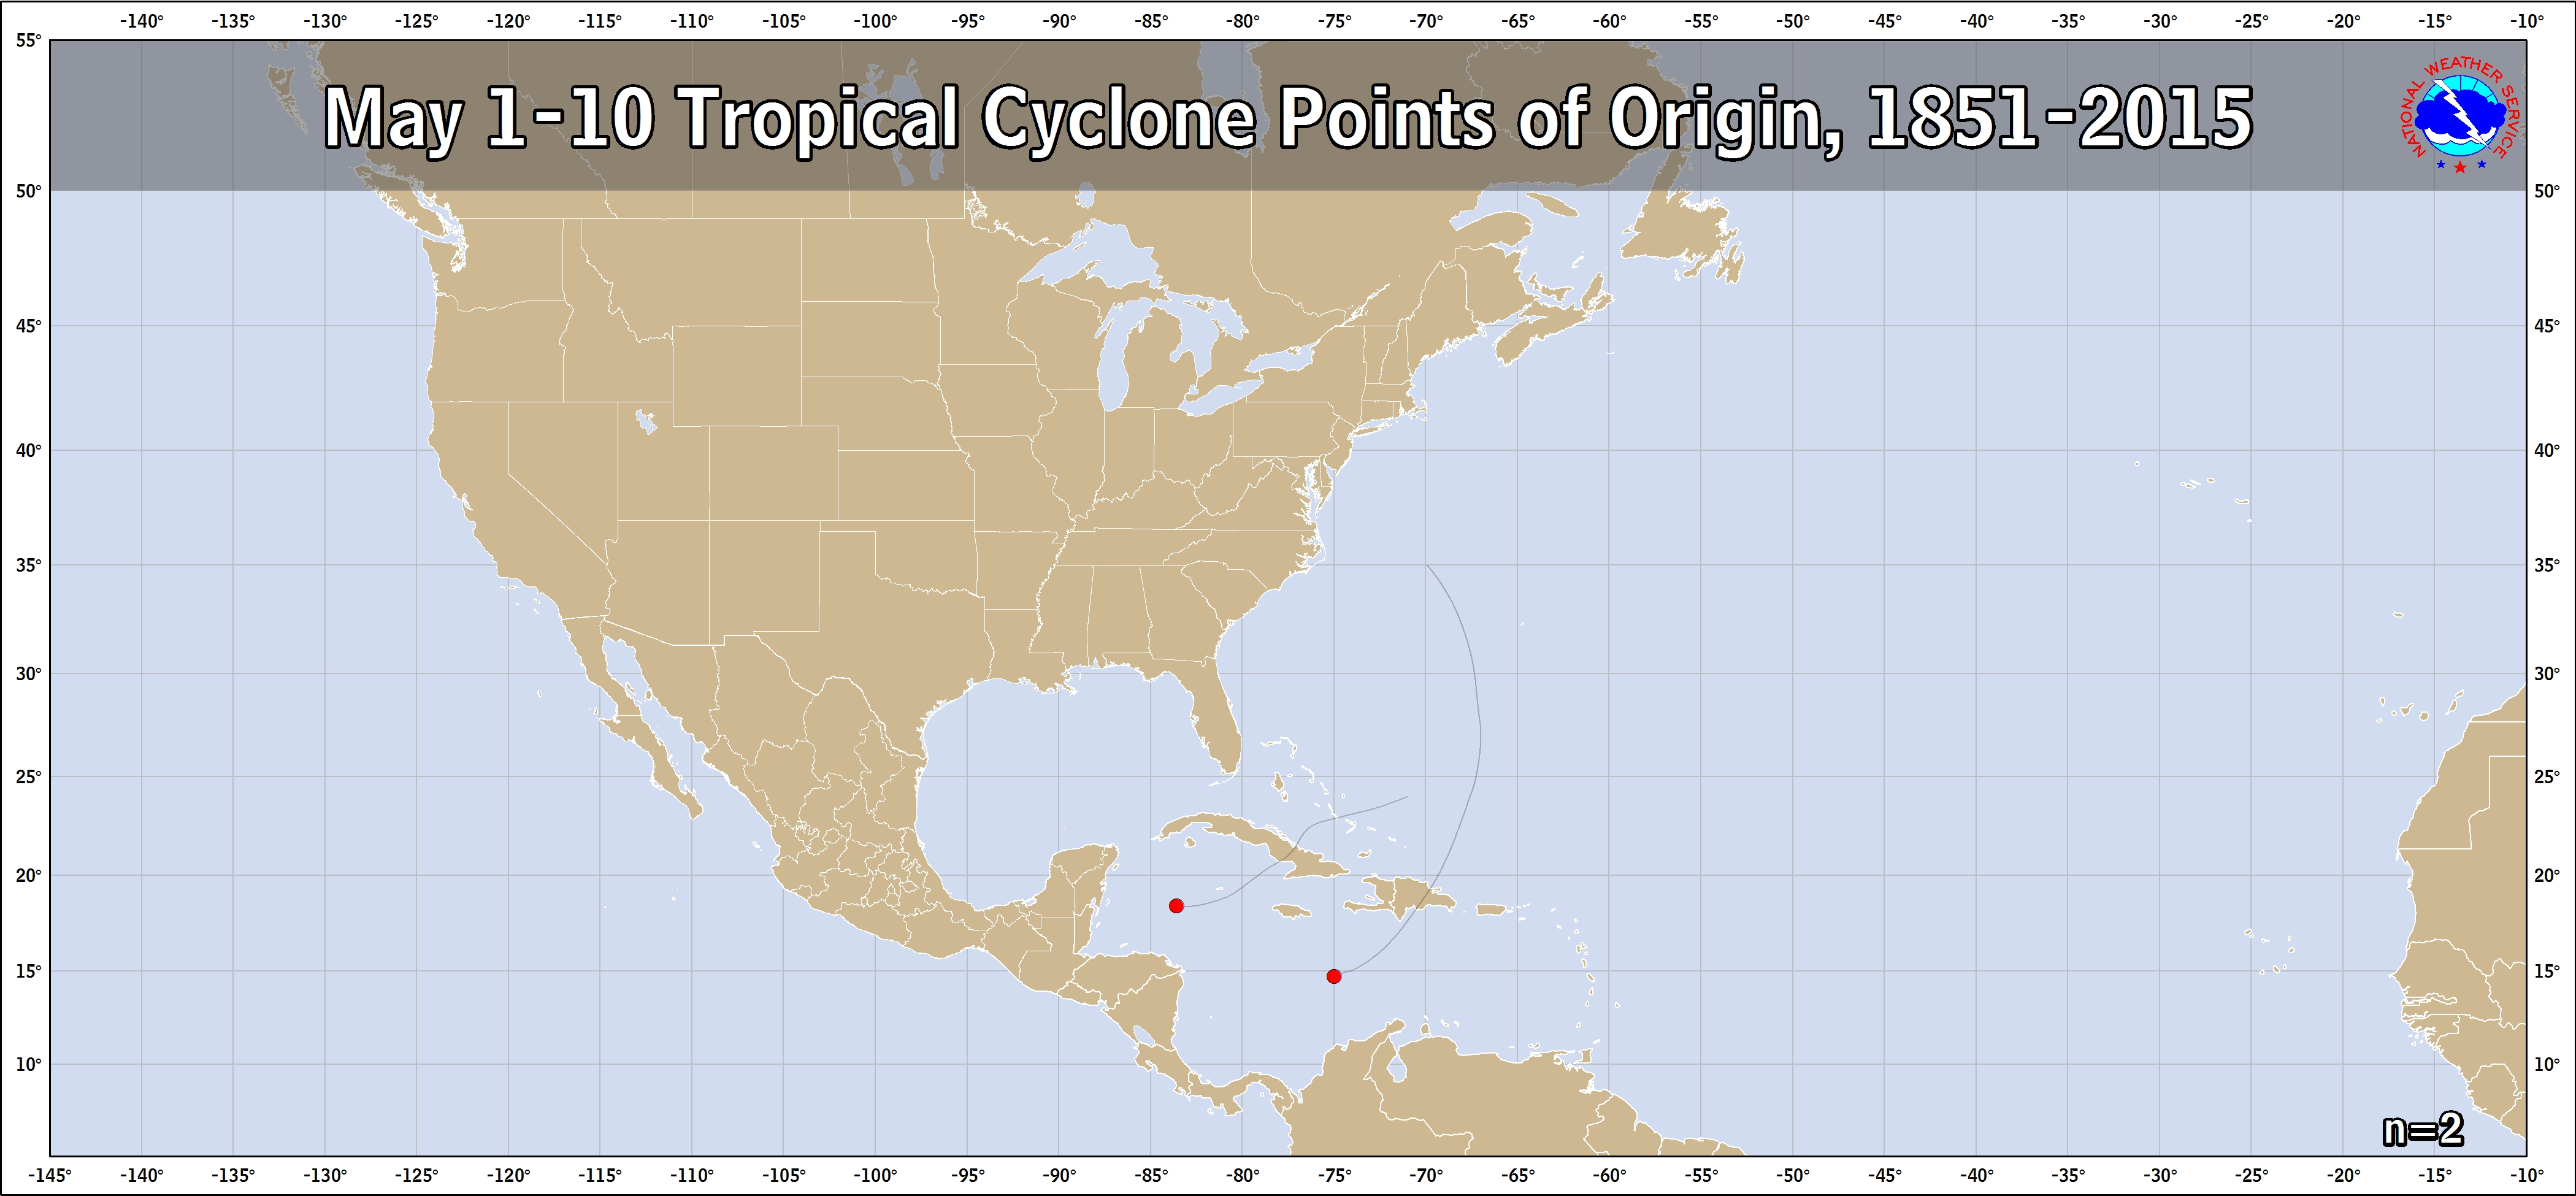
Climatological Areas of Origin and Typical Hurricane Tracks by Month

The figures below show the zones of origin and tracks for different months during the hurricane season. These figures only depict average conditions. Hurricanes can originate in different locations and travel much different paths from the average. Nonetheless, having a sense of the general pattern can give you a better picture of the average hurricane season for your area.


June Hurricane Climatology

July Hurricane Climatology

August Hurricane Climatology

September Hurricane Climatology

October Hurricane Climatology

November Hurricane Climatology


High Resolution History Maps


[Tropical Cyclone History Map for Atlantic and Eastern Pacific]

All North Atlantic and Eastern North Pacific tropical cyclones


[Hurricane History Map for Atlantic and Eastern Pacific]

All North Atlantic and Eastern North Pacific hurricanes

(at least Category 1 on the Saffir-Simpson Hurricane Scale)


[Major Hurricane History Map for Atlantic and Eastern Pacific]

All North Atlantic and Eastern North Pacific major hurricanes

(at least Category 3 on the Saffir-Simpson Hurricane Scale)

Named Cyclones by Year


[Graph of Tropical Cyclone Activity in the Atlantic Basin]

Bars depict number of named systems (open/yellow),

hurricanes (hatched/green), and category 3 or greater (solid/red), 1886-2004

Download hires image

Hurricane Return Periods

Hurricane return periods are the frequency at which a certain intensity of hurricane can be expected within a given distance of a given location (for the below images 50 nm or 58 statute miles). In simpler terms, a return period of 20 years for a major hurricane means that on average during the previous 100 years, a Category 3 or greater hurricane passed within 50 nm (58 miles) of that location about five times. We would then expect, on average, an additional five Category 3 or greater hurricanes within that radius over the next 100 years.

More information on return periods can be found from NOAA Technical Memorandum NWS NHC 38 (pdf) on the NHC Risk Analysis Program (HURISK).

Note: The information on return period is generated with the 1987 HURISK program, but uses data through 2010.


[Map of return period in years for hurricanes passing within 50 nautical miles]

Estimated return period in years for hurricanes passing

within 50 nautical miles of various locations on the U.S. Coast


[Map of return period in years for major hurricanes passing within 50 nautical miles]

Estimated return period in years for major hurricanes passing

within 50 nautical miles of various locations on the U.S. Coast

CONUS Hurricane Strikes


[Map of 1950-2011 CONUS Hurricane Strikes]

1950-2011 CONUS Hurricane Strikes (Courtesy of NCDC)

Facebook Comments