SUPPORT TRACK THE TROPICS
Over the last decade plus if you appreciate the information and tracking I provide during the season along with this website which donations help keep it running please consider a one time... recurring or yearly donation if you are able to help me out...
Venmo: @TrackTheTropicsLouisiana
Website: TrackTheTropics.com/DONATE
Venmo: @TrackTheTropicsLouisiana
Website: TrackTheTropics.com/DONATE
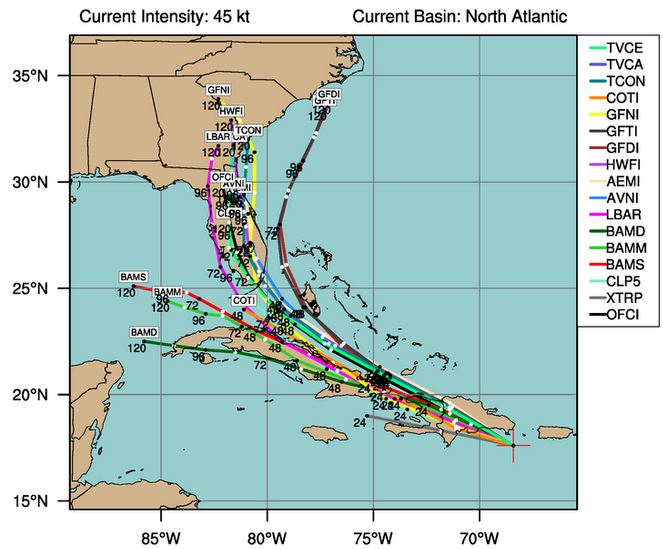 Spaghetti models (also called spaghetti plots, spaghetti charts and spaghetti diagrams) is the nickname given to the computer models that show potential tropical cyclone paths. When shown together, the individual model tracks can somewhat resemble strands of spaghetti noodles, hence the coining of this term! In short, spaghetti models give you a way to see where a tropical storm or hurricane may head. It can also give insight into whether the models are in agreement on the path of the storm or if there is a wide differing opinion on where the storm may go.
Spaghetti models are also useful in the case of a developing storm system that has not officially become a tropical depression or a tropical storm, meaning that no agency has released an official path but the system has tagged as an investigation area (Also called an invest). In these instances, spaghetti models can serve to give you an early heads up as to where a future tropical storm or hurricane may head.
However, once a tropical disturbance has officially become a tropical cyclone, different government agencies (e.g. the National Hurricane Center for the Eastern Pacific and Atlantic basins) release an official best guess path based on their analysis of the different model data and other factors. These forecasts should be used for official planning, though the spaghetti plots can still be quite useful for seeing how confident all of the models are.
Please note that these models do not speak to whether a storm will bring rainfall, hurricane-force winds, surge, or other data; they just contain information about the center of a storm's future track. An additional limitation spaghetti models have is that they don't show any representation of intensity or size of a particular storm. These are represented on different charts, usually for individual storms.
Spaghetti models (also called spaghetti plots, spaghetti charts and spaghetti diagrams) is the nickname given to the computer models that show potential tropical cyclone paths. When shown together, the individual model tracks can somewhat resemble strands of spaghetti noodles, hence the coining of this term! In short, spaghetti models give you a way to see where a tropical storm or hurricane may head. It can also give insight into whether the models are in agreement on the path of the storm or if there is a wide differing opinion on where the storm may go.
Spaghetti models are also useful in the case of a developing storm system that has not officially become a tropical depression or a tropical storm, meaning that no agency has released an official path but the system has tagged as an investigation area (Also called an invest). In these instances, spaghetti models can serve to give you an early heads up as to where a future tropical storm or hurricane may head.
However, once a tropical disturbance has officially become a tropical cyclone, different government agencies (e.g. the National Hurricane Center for the Eastern Pacific and Atlantic basins) release an official best guess path based on their analysis of the different model data and other factors. These forecasts should be used for official planning, though the spaghetti plots can still be quite useful for seeing how confident all of the models are.
Please note that these models do not speak to whether a storm will bring rainfall, hurricane-force winds, surge, or other data; they just contain information about the center of a storm's future track. An additional limitation spaghetti models have is that they don't show any representation of intensity or size of a particular storm. These are represented on different charts, usually for individual storms.
A list of the most popular hurricane spaghetti models
AVNO - NWS / American Global Forecast System (GFS model)
BAMS - Trajectory Model, Beta and Advection Model, shallow layer (NHC)
BAMM - Trajectory Model, Beta and Advection Model, medium layer (NHC)
BAMD - Trajectory Model, Beta and Advection Model, deep layer (NHC)
CLIP - CLImatology and PERsistance model 3-day
CLP5 - CLImatology and PERsistance model 5-day (CLIPER5)
CMC - Global Environmental Multiscale (GEM) model from the Canadian Meteorological Centre (Canadian model)
COTC - NRL COAMPS-TC model (Navy Regional Hurricane Model)
ECM - European Centre for Medium-Range Weather Forecasts (ECMWF)(EURO) global model
FIM9 - ESRL FIM (Flow-Following Finite-Volume Icosahedral Model)
GFDL - NWS / Geophysical Fluid Dynamics Laboratory (GFDL model)
H3GP - NCEP/AOML High-Resolution Triple Nested HWRF 3km model
HMON - Hurricane Multi-scale Ocean-coupled Non-hydrostatic model
HWRF - Hurricane Weather Research and Forecasting model
NVGM - Navy Global Environmental Model (NAVGEM)
OFCL - National Hurricane Center (NHC) official forecast
TABS - Trajectory and Beta Model, shallow layer (NHC)
TABM - Trajectory and Beta Model, medium layer (NHC)
TABD - Trajectory and Beta Model, deep layer (NHC)
TCLP - Trajectory CLImatology and PERsistance (CLIPER) model 7-day
UEMN - UKMET MOGREPS-G Ensemble Mean
XTRP - A simple extrapolation using past 12-hr motion
A fantastic list of ALL the models can be found on TropicalAtlantic.com Most models have the goal to be the very best, but each one has a different way of getting to that result. Some weather models are built on statistics, some on atmospheric dynamics, others are built on other models and others yet are built entirely on climatology and persistence of the current atmosphere.
It is important to note that two of these models above, called the CLP5 (the CLImatology and PERsistence model) and the XTRP (Extrapolated), seem to always get found on model plots, but neither contains any useful information about the forecast! These 2 models tend to mislead the general public if you do not understand what they are there for! The CLP5 uses past weather situations, or analogs, to diagnose what similar storms have done in the past. The XTRP simply extends the storm’s recent forward motion out to five days and is always a straight line. This batch of models is often called the pure statistical models. Some models just follow the winds, and they are collectively called the TABs (or Trajectory and Beta models). These three models — shallow, medium and deep — are slightly more useful because the closer they are together, they indicate that there is less wind shear in the atmosphere. On the contrary, if they are spread out, this is indicative that there's more wind shear and the system will likely stay weak. A weak system should not be monitored using the deep version of the TABs — called the TABD — since those systems do not usually tap the upper portions of the atmosphere.
The most complex are the dynamical weather models, which take into account the current state of the atmosphere using observations from the ground, ocean and air, as well as complex physics equations, to forecast the atmosphere. This suite of models includes the AVNO (GFS), ECM (EURO) and the hurricane models (HWRF and HMON), among many others.