18 Visitors Tracking The Tropics!

PLEASE DONATE TO SUPPORT

This site is AD FREE so I rely on donations to keep it running. PLEASE if you appreciate my website and the information I provide then consider a one time or recurring donation!!
Donate

Track The Tropics has been the #1 source to track the tropics 24/7 since 2013! The main goal of the site is to bring all of the important links and graphics to ONE PLACE so you can keep up to date on any threats to land during the Atlantic Hurricane Season! Hurricane Season 2024 in the Atlantic starts on June 1st and ends on November 30th. Love Spaghetti Models? Well you've come to the right place!! Remember when you're preparing for a storm: Run from the water; hide from the wind!

Saffir-Simpson Hurricane Scale
Category Wind Speed Storm Surge
  mph ft
5 ≥157 >18
4 130–156 13–18
3 111–129 9–12
2 96–110 6–8
1 74–95 4–5
Additional Classifications
Tropical Storm 39–73 0–3
Tropical Depression 0–38 0
The Saffir-Simpson Hurricane Scale is a classification used for most Western Hemisphere tropical cyclones that exceed the intensities of "tropical depressions" and "tropical storms", and thereby become hurricanes. Source: Intellicast

Hurricane Season 101

The official Atlantic Basin Hurricane Season runs from June 1st to November 30th. A tropical cyclone is a warm-core, low pressure system without any “front” attached. It develops over tropical or subtropical waters, and has an organized circulation. Depending upon location, tropical cyclones have different names around the world. The Tropical Cyclones we track in the Atlantic basin are called Tropical Depressions, Tropical Storms and Hurricanes! Atlantic Basin Tropical Cyclones are classified as follows: Tropical Depression: Organized system of clouds and thunderstorms with defined surface circulation and max sustained winds of 38 mph or less. Tropical Storm: Organized system of strong thunderstorms with a defined surface circulation and maximum sustained winds of 39-73 mph. Hurricane: Intense tropical weather system of strong thunderstorms with a well-defined surface circulation. A Hurricane has max sustained winds of 74 mph or higher!

The difference between Tropical Storm and Hurricane Watches, Warnings, Advisories and Outlooks

Warnings:Listen closely to instructions from local officials on TV, radio, cell phones or other computers for instructions from local officials.Evacuate immediately if told to do so.
  • Storm Surge Warning: There is a danger of life-threatening inundation from rising water moving inland from the shoreline somewhere within the specified area. This is generally within 36 hours. If you are under a storm surge warning, check for evacuation orders from your local officials.
  • Hurricane Warning: Hurricane conditions (sustained winds of 74 mph or greater) are expected somewhere within the specified area. NHC issues a hurricane warning 36 hours in advance of tropical storm-force winds to give you time to complete your preparations. All preparations should be complete. Evacuate immediately if so ordered.
  • Tropical Storm Warning: Tropical storm conditions (sustained winds of 39 to 73 mph) are expected within your area within 36 hours.
  • Extreme Wind Warning: Extreme sustained winds of a major hurricane (115 mph or greater), usually associated with the eyewall, are expected to begin within an hour. Take immediate shelter in the interior portion of a well-built structure.
Please note that hurricane and tropical storm watches and warnings for winds on land as well as storm surge watches and warnings can be issued for storms that the NWS believes will become tropical cyclones but have not yet attained all of the characteristics of a tropical cyclone (i.e., a closed low-level circulation, sustained thunderstorm activity, etc.). In these cases, the forecast conditions on land warrant alerting the public. These storms are referred to as “potential tropical cyclones” by the NWS. Hurricane, tropical storm, and storm surge watches and warnings can also be issued for storms that have lost some or all of their tropical cyclone characteristics, but continue to produce dangerous conditions. These storms are called “post-tropical cyclones” by the NWS. Watches: Listen closely to instructions from local officials on TV, radio, cell phones or other computers for instructions from local officials. Evacuate if told to do so.
  • Storm Surge Watch: Storm here is a possibility of life-threatening inundation from rising water moving inland from the shoreline somewhere within the specified area, generally within 48 hours. If you are under a storm surge watch, check for evacuation orders from your local officials.
  • Hurricane Watch: Huriricane conditions (sustained winds of 74 mph or greater) are possible within your area. Because it may not be safe to prepare for a hurricane once winds reach tropical storm force, The NHC issues hurricane watches 48 hours before it anticipates tropical storm-force winds.
  • Tropical Storm Watch: Tropical storm conditions (sustained winds of 39 to 73 mph) are possible within the specified area within 48 hours.
Advisories:
  • Tropical Cyclone Public Advisory:The Tropical Cyclone Public Advisory contains a list of all current coastal watches and warnings associated with an ongoing or potential tropical cyclone, a post-tropical cyclone, or a subtropical cyclone. It also provides the cyclone position, maximum sustained winds, current motion, and a description of the hazards associated with the storm.
  • Tropical Cyclone Track Forecast Cone:This graphic shows areas under tropical storm and hurricane watches and warnings, the current position of the center of the storm, and its predicted track. Forecast uncertainty is conveyed on the graphic by a “cone” (white and stippled areas) drawn such that the center of the storm will remain within the cone about 60 to 70 percent of the time. Remember, the effects of a tropical cyclone can span hundreds of miles. Areas well outside of the cone often experience hazards such as tornadoes or inland flooding from heavy rain.
Outlooks:
  • Tropical Weather Outlook:The Tropical Weather Outlook is a discussion of significant areas of disturbed weather and their potential for development during the next 5 days. The Outlook includes a categorical forecast of the probability of tropical cyclone formation during the first 48 hours and during the entire 5-day forecast period. You can also find graphical versions of the 2-day and 5-day Outlook here
Be sure to read up on tons of more information on Hurricane knowledge, preparedness, statistics and history under the menu on the left hand side of the page! Here are your 2020 Hurricane Season Names: Arthur, Bertha, Cristobal, Dolly, Edouard, Fay, Gonzalo, Hanna, Isaias, Josephine ,Kyle, Laura, Marco, Nana, Omar, Paulette, Rene, Sally, Teddy, Vicky and Wilfred!!!

TrackTheTropics Resource Links

CONUS Hurricane Strikes

1950-2017
[Map of 1950-2017 CONUS Hurricane Strikes]
Total Hurricane Strikes 1900-2010 Total Hurricane Strikes 1900-2010 Total MAJOR Hurricane Strikes 1900-2010 Total Major Hurricane Strikes 1900-2010 Western Gulf Hurricane Strikes Western Gulf Hurricane Strikes Western Gulf MAJOR Hurricane Strikes Western Gulf Major Hurricane Strikes Eastern Gulf Hurricane Strikes Eastern Gulf Hurricane Strikes Eastern Gulf MAJOR Hurricane Strikes Eastern Gulf Major Hurricane Strikes SE Coast Hurricane Strikes SE Coast Hurricane Strikes SE Coast MAJOR Hurricane Strikes SE Coast Major Hurricane Strikes NE Coast Hurricane Strikes NE Coast Hurricane Strikes NE Coast MAJOR Hurricane Strikes NE Coast Major Hurricane Strikes

Current Active Tropical Cyclones (Google Earth)

Current Active Storms (Provided by the National Hurricane Center)
[map width=”100%” height=”1000px” kml=http://www.nhc.noaa.gov/gis/kml/nhc.kmz z=”4″ lon=”-65″ lat=”25.36″]

NHC Google Earth Legend

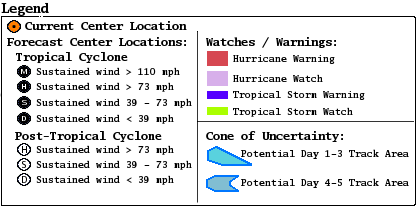
About this product:

This graphic shows an approximate representation of coastal areas under a hurricane warning (red), hurricane watch (pink), tropical storm warning (blue) and tropical storm watch (yellow). The orange circle indicates the current position of the center of the tropical cyclone. The black line and dots show the National Hurricane Center (NHC) forecast track of the center at the times indicated. The dot indicating the forecast center location will be black if the cyclone is forecast to be tropical and will be white with a black outline if the cyclone is forecast to be extratropical. If only an L is displayed, then the system is forecast to be a remnant low. The letter inside the dot indicates the NHC’s forecast intensity for that time:

D: Tropical Depression – wind speed less than 39 MPH
S: Tropical Storm – wind speed between 39 MPH and 73 MPH
H: Hurricane – wind speed between 74 MPH and 110 MPH
M: Major Hurricane – wind speed greater than 110 MPH

NHC tropical cyclone forecast tracks can be in error. This forecast uncertainty is conveyed by the track forecast “cone”, the solid white and stippled white areas in the graphic. The solid white area depicts the track forecast uncertainty for days 1-3 of the forecast, while the stippled area depicts the uncertainty on days 4-5. Historical data indicate that the entire 5-day path of the center of the tropical cyclone will remain within the cone about 60-70% of the time. To form the cone, a set of imaginary circles are placed along the forecast track at the 12, 24, 36, 48, 72, 96, and 120 h positions, where the size of each circle is set so that it encloses 67% of the previous five years official forecast errors. The cone is then formed by smoothly connecting the area swept out by the set of circles.

There is also uncertainty in the NHC intensity forecasts. The Maximum 1-minute Wind Speed Probability Table provides intensity forecast and uncertainty information.

It is also important to realize that a tropical cyclone is not a point. Their effects can span many hundreds of miles from the center. The area experiencing hurricane force (one-minute average wind speeds of at least 74 mph) and tropical storm force (one-minute average wind speeds of 39-73 mph) winds can extend well beyond the white areas shown enclosing the most likely track area of the center. The distribution of hurricane and tropical storm force winds in this tropical cyclone can be seen in the Wind History graphic linked above.

Considering the combined forecast uncertainties in track, intensity, and size, the chances that any particular location will experience winds of 34 kt (tropical storm force), 50 kt, or 64 kt (hurricane force) from this tropical cyclone are presented in tabular form for selected locations and forecast positions. This information is also presented in graphical form for the 34 kt, 50 kt, and 64 kt thresholds.

Note: A detailed definition of the NHC track forecast cone is also available.

Facebook Comments